Unlock a world of possibilities! Login now and discover the exclusive benefits awaiting you.
- Qlik Community
- :
- Forums
- :
- Analytics
- :
- App Development
- :
- Custom color in combined chart
- Subscribe to RSS Feed
- Mark Topic as New
- Mark Topic as Read
- Float this Topic for Current User
- Bookmark
- Subscribe
- Mute
- Printer Friendly Page
- Mark as New
- Bookmark
- Subscribe
- Mute
- Subscribe to RSS Feed
- Permalink
- Report Inappropriate Content
Custom color in combined chart
Hello, qlikers!
I got this chart:
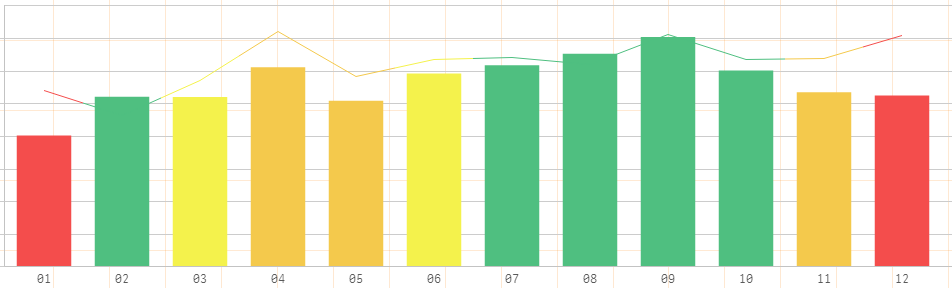
and using this expr in color by measure:

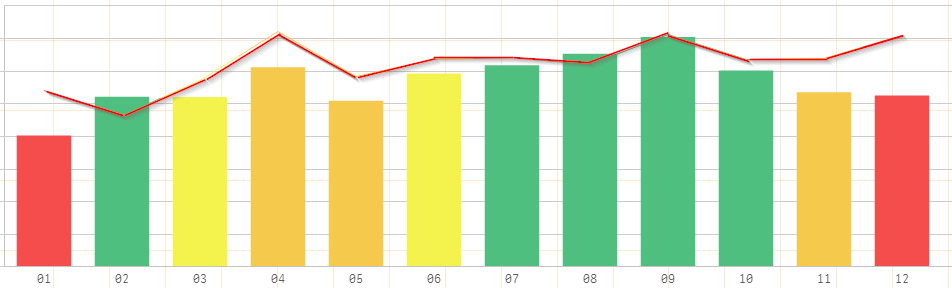
So i want to get this point -> i want to color line of plan in RED color, but color by measure colors all measures fact and plan... And i want to color plan line in RED, fact in COLOR BY MEASURE! Like this:
Help me someone please.
- « Previous Replies
-
- 1
- 2
- Next Replies »
- Mark as New
- Bookmark
- Subscribe
- Mute
- Subscribe to RSS Feed
- Permalink
- Report Inappropriate Content
Hi vasiliy_beshentsev,
One solution could be creating the red line as a Reference Line under Add-ons property. You'll need to tune your expression but at least you will be able to separate the area color coding with the line color coding.
I usually use this option to display analysis against targets (hence, the target is a straight line). But you can type in any expression to make it similar to your red line above.
Regards,
- Mark as New
- Bookmark
- Subscribe
- Mute
- Subscribe to RSS Feed
- Permalink
- Report Inappropriate Content
Xavier Garcia написал(а):
One solution could be creating the red line as a Reference Line under Add-ons property.
This feature available only in bar charts, not in combined charts.
I'm already try to make this in bar charts with reference line with plan measure, but it won't draw this line. Looks like reference line add-on works only with scalar value.
- Mark as New
- Bookmark
- Subscribe
- Mute
- Subscribe to RSS Feed
- Permalink
- Report Inappropriate Content
I don't think it's possible
mto, can u please add this feature? the possiblity to combine the way to color measures separately in the graphic charts? as it's the case in table and kpi charts?
- Mark as New
- Bookmark
- Subscribe
- Mute
- Subscribe to RSS Feed
- Permalink
- Report Inappropriate Content
According to the documentation you privded, you can type in any numerical expression as reference line.
You need to be careful, though, sometimes it won't draw if it doesn't fall within the current range of the measure axis.
- Mark as New
- Bookmark
- Subscribe
- Mute
- Subscribe to RSS Feed
- Permalink
- Report Inappropriate Content
you can't add a reference line in the case; a refrence line is an horizantal line
- Mark as New
- Bookmark
- Subscribe
- Mute
- Subscribe to RSS Feed
- Permalink
- Report Inappropriate Content
Hi Omar - I added the ability to add a reference line to a combo chart to our ideation system.
In regards to color measures separate - here is what I know - I replied to a similar post earlier today - I will post it here too:
For the February release we’ve added the option in color by to color by currently used dimension/measure and using this setting you will then get back the gradient. The benefit of coloring by currently used dimension/measure is also that when a user has alternative data we can keep on coloring it by what dimension is being used. Like in a pie chart when you switch dimension we will also switch the dimension we color by.
ou could also say that we now have the option to color by “relative” data instead of “absolute”.

Hope this helps
When applicable please mark the appropriate replies as CORRECT. This will help community members and Qlik Employees know which discussions have already been addressed and have a possible known solution. Please mark threads as HELPFUL if the provided solution is helpful to the problem, but does not necessarily solve the indicated problem. You can mark multiple threads as HELPFUL if you feel additional info is useful to others.
Regards,
Michael Tarallo (@mtarallo) | Twitter
Mike Tarallo
Qlik
- Mark as New
- Bookmark
- Subscribe
- Mute
- Subscribe to RSS Feed
- Permalink
- Report Inappropriate Content
Hi Mike and thanks for the quick reaction,
That's not the same thing; what we want to have is the possiblity to colour 2 measures in different ways:
I mean, sthing like coloring in the simple table; in which we can color each column seperately.
Won't this be possible in other charts? And with that, we can color the first measure red (as a master measure) and the second one by expression.
We also have this kind of capability in the kpi object in which we can color each measure apart..
Hope that was clear?
- Mark as New
- Bookmark
- Subscribe
- Mute
- Subscribe to RSS Feed
- Permalink
- Report Inappropriate Content
Hi Omar - Let me look at my Feb 2018 release - from what I saw - I can color 2 different measures differently in a chart - I'll come back to you shortly.
Mike Tarallo
Qlik
- Mark as New
- Bookmark
- Subscribe
- Mute
- Subscribe to RSS Feed
- Permalink
- Report Inappropriate Content
hi, Mike!
It's definitely what i want to do! I want to color each measure in different "color by expr"
- « Previous Replies
-
- 1
- 2
- Next Replies »