Unlock a world of possibilities! Login now and discover the exclusive benefits awaiting you.
- Qlik Community
- :
- Forums
- :
- Analytics
- :
- App Development
- :
- Data transformation: Rows to Columns
- Subscribe to RSS Feed
- Mark Topic as New
- Mark Topic as Read
- Float this Topic for Current User
- Bookmark
- Subscribe
- Mute
- Printer Friendly Page
- Mark as New
- Bookmark
- Subscribe
- Mute
- Subscribe to RSS Feed
- Permalink
- Report Inappropriate Content
Data transformation: Rows to Columns
Hi all! I have a spreadsheet of reimbursements- where every transaction has it's own row (see below):
| Name | Amount | Date |
|---|---|---|
| John Smith | $10.00 | 1-2-15 |
| John Smith | $5.00 | 1-3-15 |
| Jane Duncan | $15.00 | 1-4-15 |
| Jane Duncan | $15.00 | 1-5-15 |
| Jane Duncan | $25.00 | 1-6-15 |
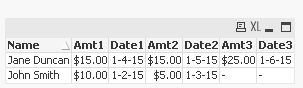
I'd like to combine the data so each person gets their own row, and every amount and date for that person becomes it's own column:
| Name | Amount (1) | Date (1) | Amount (2) | Date (2) | Amount (3) | Date (3) |
|---|---|---|---|---|---|---|
| John Smith | $10.00 | 1-2-15 | $5.00 | 1-3-15 | ||
| Jane Duncan | $15.00 | 1-4-15 | $15.00 | 1-5-15 | $25.00 | 1-6-15 |
How might I transform the data in the load script to accomplish this?
Thanks!
Katie
- Mark as New
- Bookmark
- Subscribe
- Mute
- Subscribe to RSS Feed
- Permalink
- Report Inappropriate Content
use cross table
- Mark as New
- Bookmark
- Subscribe
- Mute
- Subscribe to RSS Feed
- Permalink
- Report Inappropriate Content
I think you would need Generic Load here: The Generic Load
Table:
LOAD Name,
SubField(Amt, '|', 1) as Amt1,
SubField(Amt, '|', 2) as Amt2,
SubField(Amt, '|', 3) as Amt3,
SubField(Date, '|', 1) as Date1,
SubField(Date, '|', 2) as Date2,
SubField(Date, '|', 3) as Date3;
LOAD Name,
Concat(Amount, '|', RecNo()) as Amt,
Concat(Date, '|', RecNo()) as Date
FROM
[https://community.qlik.com/thread/196603]
(html, codepage is 1252, embedded labels, table is @1)
Group By Name;
- Mark as New
- Bookmark
- Subscribe
- Mute
- Subscribe to RSS Feed
- Permalink
- Report Inappropriate Content
could you not just use the pivot table object to display the content that way? Altering how you load your data for visualisation purposes beyond the standard fact vs dimension model discussions seems the wrong approach unless I'm missing something.