Unlock a world of possibilities! Login now and discover the exclusive benefits awaiting you.
- Qlik Community
- :
- Forums
- :
- Analytics
- :
- App Development
- :
- Re: Display all values including repetitive Dimens...
- Subscribe to RSS Feed
- Mark Topic as New
- Mark Topic as Read
- Float this Topic for Current User
- Bookmark
- Subscribe
- Mute
- Printer Friendly Page
- Mark as New
- Bookmark
- Subscribe
- Mute
- Subscribe to RSS Feed
- Permalink
- Report Inappropriate Content
Display all values including repetitive Dimension values in a Scatter Plot?
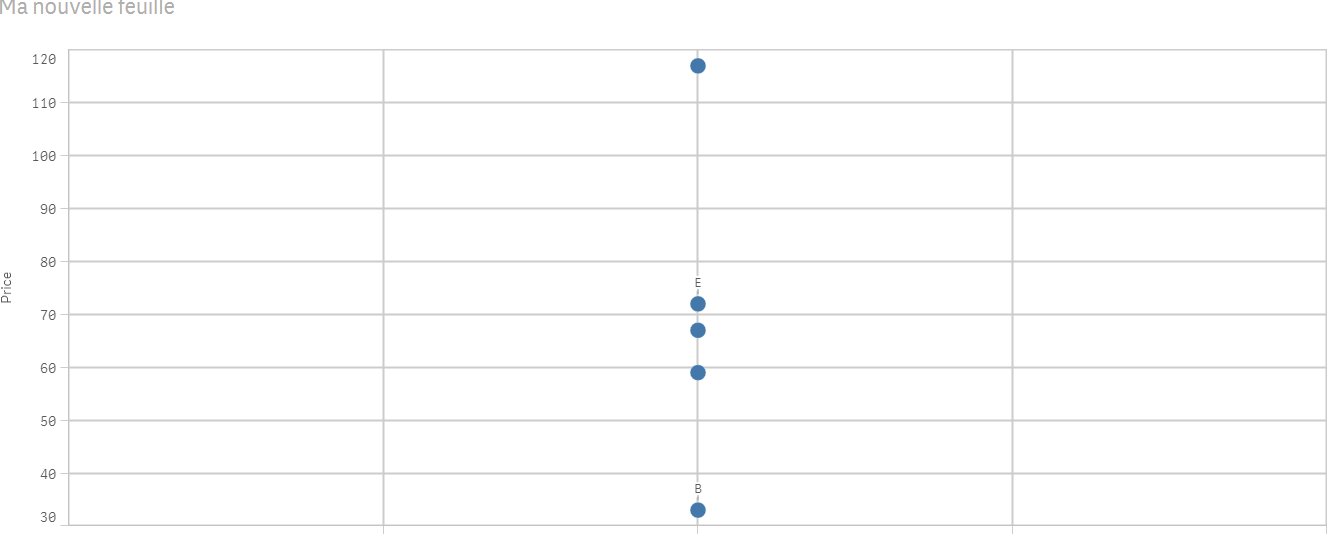
I have a dataset as shown below:
Month Stock Price
2 A 21
2 B 33
2 A 46
2 C 54
2 D 59
2 C 63
2 E 72
I'd like to show these values on a Scatter plot: With Stock as the dimension, Month as the X-axis and Price(without any aggregation) as Y-axis. I've tried this but the Stocks A and C are not being shown in the plot. Is there any way to show A and C, twice in this instant with their different prices in the Scatter plot? If not please suggest a different but similar chart where I can show all the above points.
TIA.
- « Previous Replies
-
- 1
- 2
- Next Replies »
Accepted Solutions
- Mark as New
- Bookmark
- Subscribe
- Mute
- Subscribe to RSS Feed
- Permalink
- Report Inappropriate Content
Check the attached

If a post helps to resolve your issue, please accept it as a Solution.
- Mark as New
- Bookmark
- Subscribe
- Mute
- Subscribe to RSS Feed
- Permalink
- Report Inappropriate Content
As dimension:
Stock
As measure:
1) Month
2) =AGGR(NODISTINCT sum(Price),Stock)
result :
- Mark as New
- Bookmark
- Subscribe
- Mute
- Subscribe to RSS Feed
- Permalink
- Report Inappropriate Content
Hello omar bensalem,
Thanks for the reply. But you see I don't want to Sum the Prices. I want to display each and every point in the dataset above. That is I need A to be shown as two points: One point with price 21 and other with 46. Similarly, C should be displayed twice: one point with price 54 and the other with price 63. Is there a way to do so? TIA.
- Mark as New
- Bookmark
- Subscribe
- Mute
- Subscribe to RSS Feed
- Permalink
- Report Inappropriate Content
- Mark as New
- Bookmark
- Subscribe
- Mute
- Subscribe to RSS Feed
- Permalink
- Report Inappropriate Content
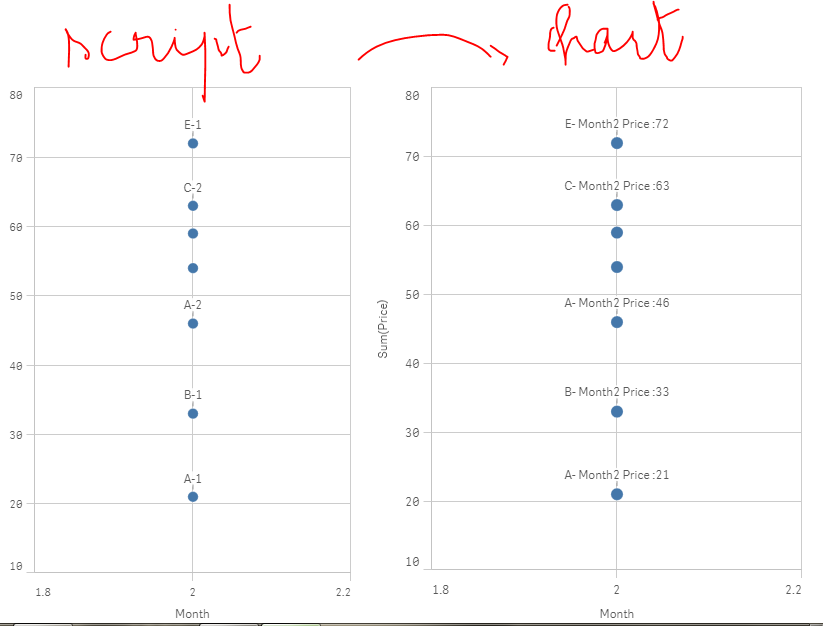
Group your Data by Stock and the instance of each Price that occurs and use the new Field as Dimension
LOAD *,Stock&'-'&AutoNumber(Stock&Month&Price,Stock) as Stock_New INLINE [
Month,Stock,Price
2,A,21
2,B,33
2,A,46
2,C,54
2,D,59
2,C,63
2,E,72
];
If a post helps to resolve your issue, please accept it as a Solution.
- Mark as New
- Bookmark
- Subscribe
- Mute
- Subscribe to RSS Feed
- Permalink
- Report Inappropriate Content
Check the attached
If a post helps to resolve your issue, please accept it as a Solution.
- Mark as New
- Bookmark
- Subscribe
- Mute
- Subscribe to RSS Feed
- Permalink
- Report Inappropriate Content
That's brilliant and correct; but suppose we do not have access to the script; and we had to make this directly within the scatter plot? How should we proceed?
- Mark as New
- Bookmark
- Subscribe
- Mute
- Subscribe to RSS Feed
- Permalink
- Report Inappropriate Content
Don't know, but me let try me a few things and get back
If a post helps to resolve your issue, please accept it as a Solution.
- Mark as New
- Bookmark
- Subscribe
- Mute
- Subscribe to RSS Feed
- Permalink
- Report Inappropriate Content
Is there any way of generating autonumber-like numbers directly within the charts?
The ponly way I could think of is using a dimension like this:
=Stock&'- Month'&Month&' Price :'&Price
- Mark as New
- Bookmark
- Subscribe
- Mute
- Subscribe to RSS Feed
- Permalink
- Report Inappropriate Content
You can use Rowno()
=AGGR(Stock&'-'&Rowno(),Stock,Month,Price)
Attaching updated app
If a post helps to resolve your issue, please accept it as a Solution.
- « Previous Replies
-
- 1
- 2
- Next Replies »