Unlock a world of possibilities! Login now and discover the exclusive benefits awaiting you.
- Qlik Community
- :
- Forums
- :
- Analytics
- :
- App Development
- :
- Dynamic Rolling 13 Months with year selection
- Subscribe to RSS Feed
- Mark Topic as New
- Mark Topic as Read
- Float this Topic for Current User
- Bookmark
- Subscribe
- Mute
- Printer Friendly Page
- Mark as New
- Bookmark
- Subscribe
- Mute
- Subscribe to RSS Feed
- Permalink
- Report Inappropriate Content
Dynamic Rolling 13 Months with year selection
I'm trying to allow for financial periods (13 months) to be visible with year selections. So when 2017 and a month is chosen, we see 2017 + Dec 2016, and so on. I'm aware there is a set analysis solution to this but the specific visualization uses a cyclic expression with the following expression.
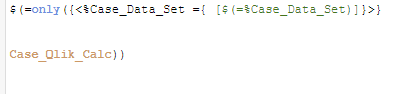
Where Case_Qlik_Calc is a data island that will have an expression loaded in the rows, the set analysis here allows us to modify whatever is in the chart to whatever KPI a user wants to see.
Currently I have the following set up.
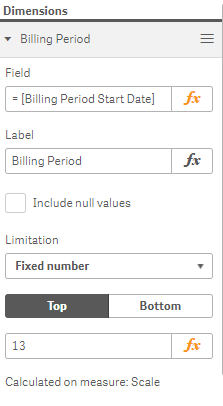
Where the measure Scale uses the following set analysis to show 1, if it falls in the correct date range, and 0 if not.
{<[Billing Period Start Date Month] = ,
[Billing Period Start Date Year] = ,
[Billing Period Start Date] = {"$(='>' & Date(AddMonths(Max([Billing Period Start Date]),-12), 'MMM-YYYY') & '<=' & Date(AddMonths(Max([Billing Period Start Date]),1), 'MMM-YYYY'))"}>}
The result is the following....
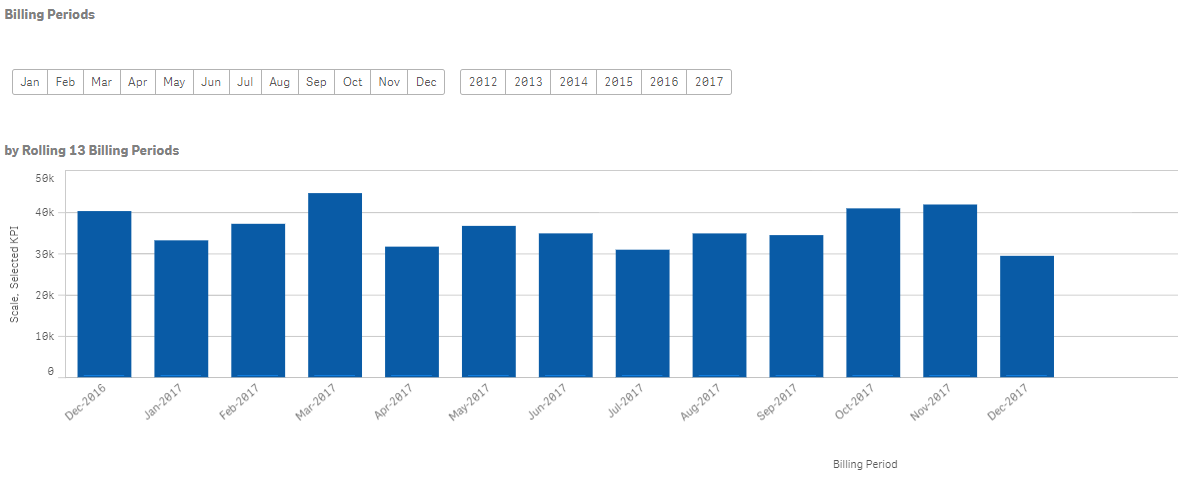
With no selection, correct values. 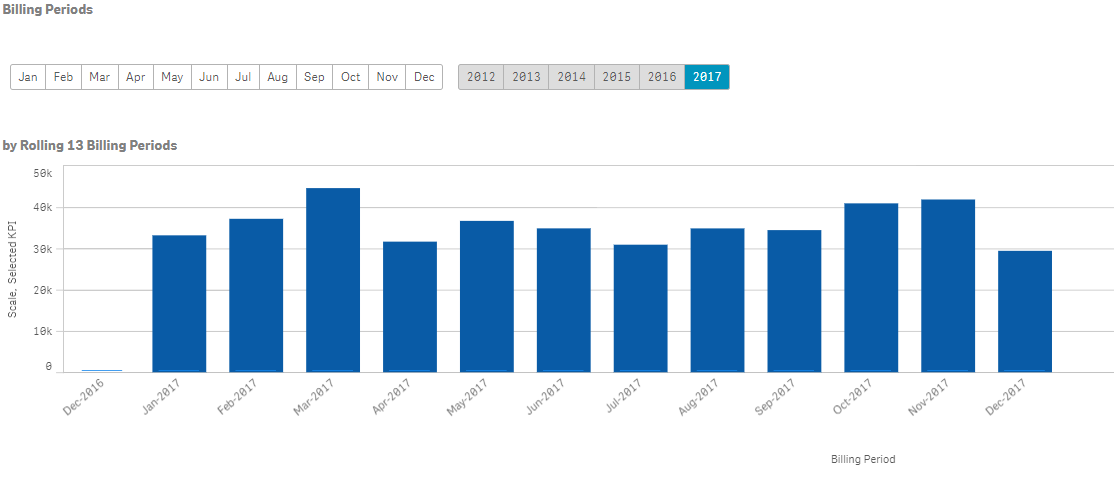
With a selection. We still get the Scale value at 1, but it hasn't translated to the other expression.
I know a solution to this is to put the set analysis in a variable and store it in all the expressions we cycle through, but I was wondering if there's any easier to way to tackle this problem of tackling financial calendars with.
An ability to do the top 13 dimension values present on whatever selection would be ideal.