Unlock a world of possibilities! Login now and discover the exclusive benefits awaiting you.
- Qlik Community
- :
- Forums
- :
- Analytics
- :
- App Development
- :
- Re: Employee working shift pivot table
- Subscribe to RSS Feed
- Mark Topic as New
- Mark Topic as Read
- Float this Topic for Current User
- Bookmark
- Subscribe
- Mute
- Printer Friendly Page
- Mark as New
- Bookmark
- Subscribe
- Mute
- Subscribe to RSS Feed
- Permalink
- Report Inappropriate Content
Employee working shift pivot table
Hello Qlik community,
I work at an employment center, I'm using Qlik Sense Enterprise, and I'm trying to make a pivot table to easily keep track of the working shifts.
Every month I get txt or csv files like this from the comapanies they work for:
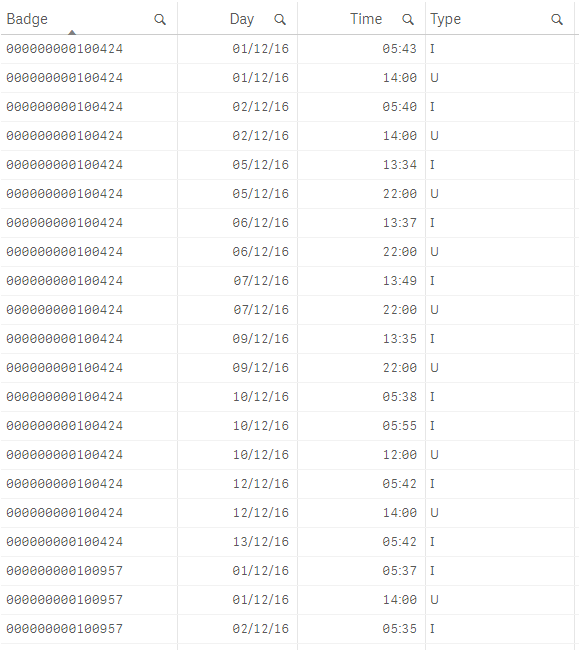
"I" and "U" are just "in" and "out" which are very important because sometimes employees work 10pm to 6am of the next day, or they make breaks in a day.
I just need something like this:
+ Badge In Out In Out
- Day 1 09:00 13:00 14:00 18:00
- Day 2 09:00 13:00 14:00 18:00
- Day 3 09:00 13:00 14:00 18:00
Basically for each Badge (employee ID), for each day, I need to see a list of the times they used the badge and the flag "in" or "out".
For now I'm using something basic like this:
 _ Fogli - Qlik Sense.png)
But it's not the best and it's still hard for the paycheck team to work with.
Also: any way to filter out those zeros in the badge? I really just need the last 6 digits.
Thank you in advance!
- Mark as New
- Bookmark
- Subscribe
- Mute
- Subscribe to RSS Feed
- Permalink
- Report Inappropriate Content
Ok so I made this, putting everything into a row and a "fake" measure so that the pivot would show.
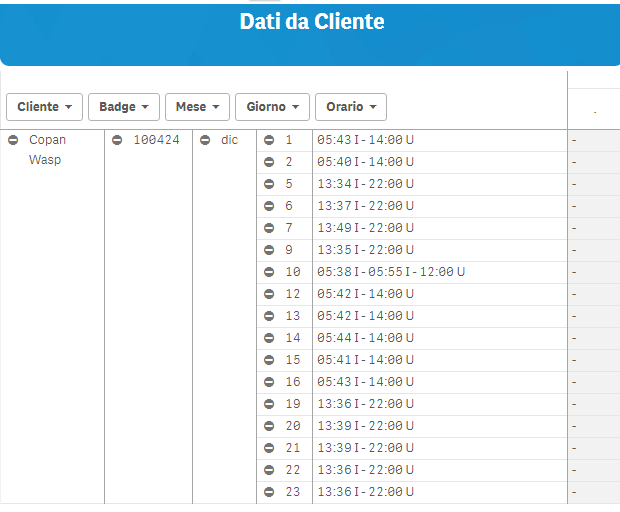
Is there a way to show the time stamp concat into columns? I've had to put a fake measure there so the pivot would show, but ideally the timestamps should show in the column fields (divided by day?)