Unlock a world of possibilities! Login now and discover the exclusive benefits awaiting you.
- Qlik Community
- :
- Forums
- :
- Analytics
- :
- App Development
- :
- Expression to use for 'Comparable' Locations
- Subscribe to RSS Feed
- Mark Topic as New
- Mark Topic as Read
- Float this Topic for Current User
- Bookmark
- Subscribe
- Mute
- Printer Friendly Page
- Mark as New
- Bookmark
- Subscribe
- Mute
- Subscribe to RSS Feed
- Permalink
- Report Inappropriate Content
Expression to use for 'Comparable' Locations
Good Morning!
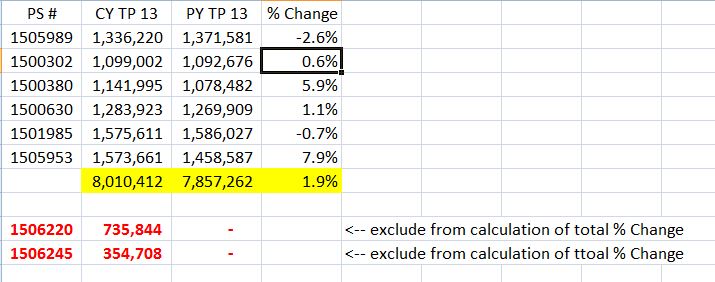
I load data for each of our locations that contains sales performance. It is structured like this:
Unit #
Current Year Sales ("CY TP 13")
Year Ago Sales ("PY TP 13")
From there, I use the following formula to highlight % Change Vs Ya
AVG ([CY TP 13])/avg([PY TP 13])-1
The problem is, I need to create a chart (perhaps a TreeMap), that only displays the data of 'comparable' locations, since some locations that are reporting sales this year weren't open last year, distorting the % change statistic. In other words, I want to calculate locations where PY TP 13>0.
In my example, what would the expression be in the expression editor?
Thanks for any help that can be provided?
- « Previous Replies
-
- 1
- 2
- Next Replies »
- Mark as New
- Bookmark
- Subscribe
- Mute
- Subscribe to RSS Feed
- Permalink
- Report Inappropriate Content
I sum CY, then Sum LY, then use the formula (Sum CY/Sum LY)-1
- Mark as New
- Bookmark
- Subscribe
- Mute
- Subscribe to RSS Feed
- Permalink
- Report Inappropriate Content
- Mark as New
- Bookmark
- Subscribe
- Mute
- Subscribe to RSS Feed
- Permalink
- Report Inappropriate Content
Try this:
Sum({<[Comp_Flag] = {1}>} [CY TP 13])/Sum([PY TP 13]) - 1
- Mark as New
- Bookmark
- Subscribe
- Mute
- Subscribe to RSS Feed
- Permalink
- Report Inappropriate Content
Outstanding!! Thank You, Sunny!!
- « Previous Replies
-
- 1
- 2
- Next Replies »