Unlock a world of possibilities! Login now and discover the exclusive benefits awaiting you.
- Qlik Community
- :
- Forums
- :
- Analytics
- :
- App Development
- :
- Filtering data without using a filter pane
- Subscribe to RSS Feed
- Mark Topic as New
- Mark Topic as Read
- Float this Topic for Current User
- Bookmark
- Subscribe
- Mute
- Printer Friendly Page
- Mark as New
- Bookmark
- Subscribe
- Mute
- Subscribe to RSS Feed
- Permalink
- Report Inappropriate Content
Filtering data without using a filter pane
Hi,
I want to filter data from a chart (just remove a some data based on a simple text based dimension) but can't seem to do it without a filter pane. I don't want the pane to take up any room on my sheet (and don't ever need to change the filter)
Cheers
Tom
Accepted Solutions
- Mark as New
- Bookmark
- Subscribe
- Mute
- Subscribe to RSS Feed
- Permalink
- Report Inappropriate Content
Two easy options.
Both methods are achieved by adjusting the existing Measure formula. If you have multiple measures, apply the same technique to all measures in the chart.
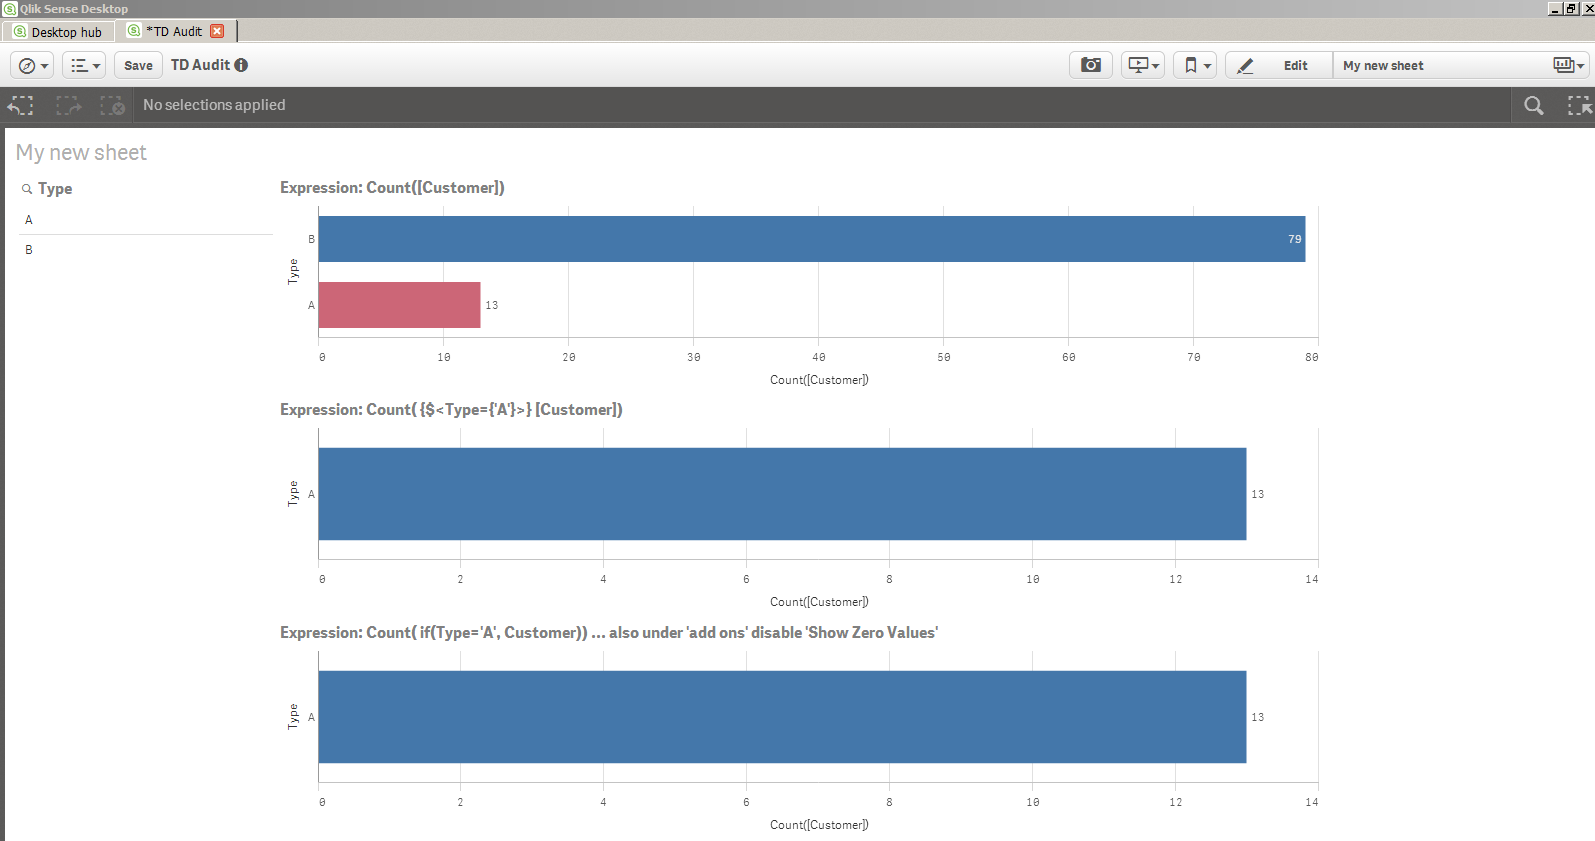
1. Set Analysis (shown in middle , it puts a filter into the chart object only and is done within the measure/expression formula ). The SET expression is very powerful and is described in the help under 'SET ANALYSIS'. In the sample expression i wrote, the chart will 'listen' to all filters that the user makes and regardless of any filter applied on the Type field, will apply Type='A' to the chart that the measure exists in. There are many possibilities.
2.Good old 'If Statement' & 'hide zero values' (shown at bottom, it effectively filters the chart object by only counting values where Type in this case ='A'. In this situation you also have to disable 'show zero values' under the add-on section oft he chart properties.
I can also post the .QVF if that will help further.
- Mark as New
- Bookmark
- Subscribe
- Mute
- Subscribe to RSS Feed
- Permalink
- Report Inappropriate Content
Hi Tom,
With Qlik Sense - you could use the Global Smart Search option - where you can type in the text value - or the Global Selections panel. This will enable selection possibilities without the need for a filter list box to be displayed on the sheet.
If you have a minute check these short videos out that demonstrate this and more.
- Qlik Sense - Selections that make "Sense"
- Qlik Sense - Global Smart Search (video)
- New to Qlik Sense Videos (other - just in case you need them)
Let me know if this helps you.
Please mark the appropriate replies as helpful / correct so our team and other members know that your question(s) has been answered to your satisfaction.
Regards,
Mike
Mike Tarallo
Qlik
- Mark as New
- Bookmark
- Subscribe
- Mute
- Subscribe to RSS Feed
- Permalink
- Report Inappropriate Content
Thanks Mike,
Perhaps I could have been clearer!
I have one data set, a list of invoices, each invoice has a type associated with it. Assume we have type A and type B invoices. I actually want two charts on my dashboard, one showing invoices of Type A and one showing invoices of Type B. I think global search will affect both charts.
So I want to set a design time filter which is preserved for each chart.
Cheers
Tom
- Mark as New
- Bookmark
- Subscribe
- Mute
- Subscribe to RSS Feed
- Permalink
- Report Inappropriate Content
Ok Tom thanks. Let me see if one of my colleagues can chime in here.
Jonathan Poole can you take a quick look?
Thank you
Mike
Mike Tarallo
Qlik
- Mark as New
- Bookmark
- Subscribe
- Mute
- Subscribe to RSS Feed
- Permalink
- Report Inappropriate Content
Two easy options.
Both methods are achieved by adjusting the existing Measure formula. If you have multiple measures, apply the same technique to all measures in the chart.
1. Set Analysis (shown in middle , it puts a filter into the chart object only and is done within the measure/expression formula ). The SET expression is very powerful and is described in the help under 'SET ANALYSIS'. In the sample expression i wrote, the chart will 'listen' to all filters that the user makes and regardless of any filter applied on the Type field, will apply Type='A' to the chart that the measure exists in. There are many possibilities.
2.Good old 'If Statement' & 'hide zero values' (shown at bottom, it effectively filters the chart object by only counting values where Type in this case ='A'. In this situation you also have to disable 'show zero values' under the add-on section oft he chart properties.
I can also post the .QVF if that will help further.
- Mark as New
- Bookmark
- Subscribe
- Mute
- Subscribe to RSS Feed
- Permalink
- Report Inappropriate Content
Thanks, the if method worked, cheers.
- Mark as New
- Bookmark
- Subscribe
- Mute
- Subscribe to RSS Feed
- Permalink
- Report Inappropriate Content
There are some drawbacks actually :
Set analysis : not user friendly to say the least 😄 and you need a measure to apply
the if solution : bad in performance, and you have either to do a "filter field" (so another column), either doing an "hidden filter", meaning if the user click on it, he will see the formula in the upper filter panel instead of the field and make a selection he won't understand.
There is an idea to make it a property of the chart :
https://community.qlik.com/t5/Qlik-Sense-Enterprise-Ideas/Chart-Filter-Get-rid-of-Qlik-Sense-biggest...
- Mark as New
- Bookmark
- Subscribe
- Mute
- Subscribe to RSS Feed
- Permalink
- Report Inappropriate Content
Yes, this would really help - does anyone know how it works if you have a simple table to be filtered and not a chart