Unlock a world of possibilities! Login now and discover the exclusive benefits awaiting you.
- Qlik Community
- :
- Forums
- :
- Analytics
- :
- App Development
- :
- Finding "first" values for line chart with cumulat...
- Subscribe to RSS Feed
- Mark Topic as New
- Mark Topic as Read
- Float this Topic for Current User
- Bookmark
- Subscribe
- Mute
- Printer Friendly Page
- Mark as New
- Bookmark
- Subscribe
- Mute
- Subscribe to RSS Feed
- Permalink
- Report Inappropriate Content
Finding "first" values for line chart with cumulative percentage
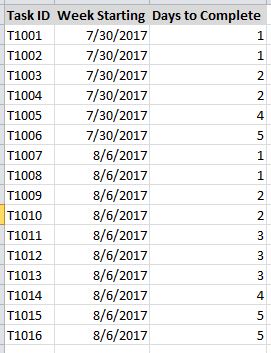
Hi, I have a set of data like below. These are tasks that happen during a specific week and take a number of days to complete. I'm trying to build a line chart that would have 3 lines and show by week how many days it took for the tasks to be 50% complete, 80% complete and finally 100% complete. I can get the accumulated percentages for each day value by week in a pivot table but I can't come up with a way to take the first number of days value for a particular percentage and chart it. For example in the data below, I know for the week of 7/30 that after 1 day the tasks were 33.33% complete, after 2 days 66.66% complete, after 4 days 83.33% complete and after 5 days 100% complete. I'd like to chart for that week that it took 2 days to get to (or above) 50% complete, 4 days to 80%, and 5 days to 100%. The three percentage buckets would be separate lines with the y values as the number of days, and the x values as the week starting.
Thanks in advance for any ideas.
Accepted Solutions
- Mark as New
- Bookmark
- Subscribe
- Mute
- Subscribe to RSS Feed
- Permalink
- Report Inappropriate Content
Something like this?
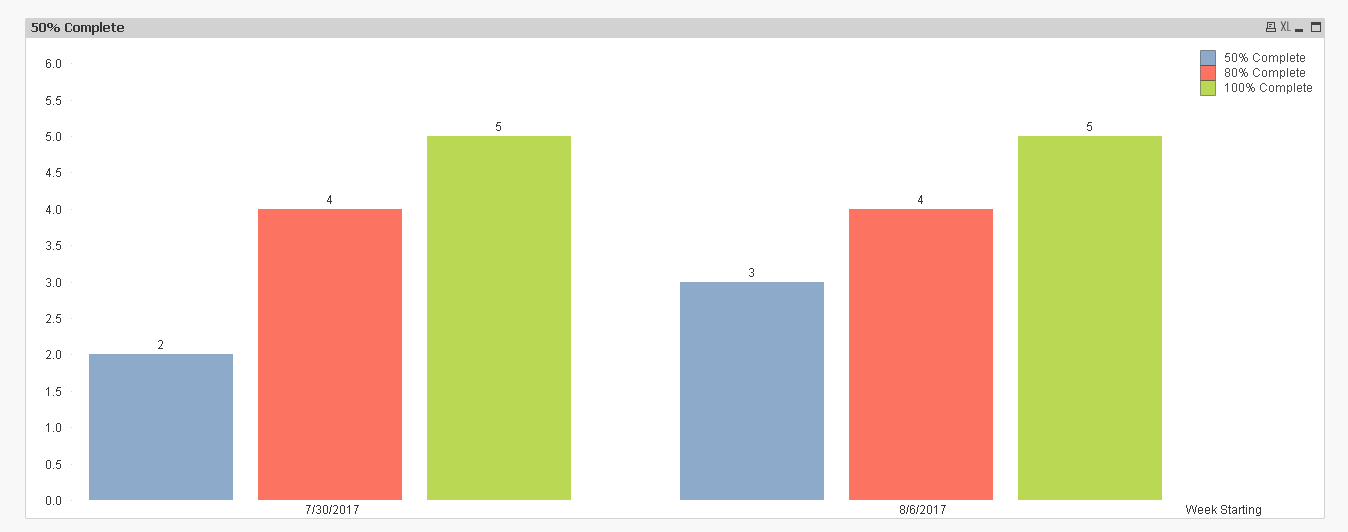
50% Complete
=Min(Aggr(If(RowNo() >= Round(Count(DISTINCT TOTAL <[Week Starting]> [Task ID]) *0.50), [Days to Complete]), [Week Starting], [Task ID]))
80% Complete
=Min(Aggr(If(RowNo() >= Round(Count(DISTINCT TOTAL <[Week Starting]> [Task ID]) *0.80), [Days to Complete]), [Week Starting], [Task ID]))
100% Complete
=Min(Aggr(If(RowNo() >= Round(Count(DISTINCT TOTAL <[Week Starting]> [Task ID])), [Days to Complete]), [Week Starting], [Task ID]))
- Mark as New
- Bookmark
- Subscribe
- Mute
- Subscribe to RSS Feed
- Permalink
- Report Inappropriate Content
Wayne Antinore wrote:
For example in the data below, I know for the week of 7/30 that after 1 day the tasks were 33.33% complete, after 2 days 66.66% complete, after 4 days 83.33% complete and after 5 days 100% complete.
How do you know this? Is this for a specific Task ID or all Task IDs?
- Mark as New
- Bookmark
- Subscribe
- Mute
- Subscribe to RSS Feed
- Permalink
- Report Inappropriate Content
Hi Sunny, thanks for the reply. This is for all Task ID in the same week. For the week of 7/30/2017 there were 6 tasks, 2 of them took 1 day to complete so that would be 33.33%
- Mark as New
- Bookmark
- Subscribe
- Mute
- Subscribe to RSS Feed
- Permalink
- Report Inappropriate Content
Something like this?
50% Complete
=Min(Aggr(If(RowNo() >= Round(Count(DISTINCT TOTAL <[Week Starting]> [Task ID]) *0.50), [Days to Complete]), [Week Starting], [Task ID]))
80% Complete
=Min(Aggr(If(RowNo() >= Round(Count(DISTINCT TOTAL <[Week Starting]> [Task ID]) *0.80), [Days to Complete]), [Week Starting], [Task ID]))
100% Complete
=Min(Aggr(If(RowNo() >= Round(Count(DISTINCT TOTAL <[Week Starting]> [Task ID])), [Days to Complete]), [Week Starting], [Task ID]))
- Mark as New
- Bookmark
- Subscribe
- Mute
- Subscribe to RSS Feed
- Permalink
- Report Inappropriate Content
Hi Sunny,
That's it! Thank you very much. I had to work out the sorting so it worked correctly with the AGGR function. Thanks again!
Wayne