Unlock a world of possibilities! Login now and discover the exclusive benefits awaiting you.
- Qlik Community
- :
- Forums
- :
- Analytics
- :
- App Development
- :
- Re: Get Min, Max, AVG and Median in One Graph?
- Subscribe to RSS Feed
- Mark Topic as New
- Mark Topic as Read
- Float this Topic for Current User
- Bookmark
- Subscribe
- Mute
- Printer Friendly Page
- Mark as New
- Bookmark
- Subscribe
- Mute
- Subscribe to RSS Feed
- Permalink
- Report Inappropriate Content
Get Min, Max, AVG and Median in One Graph?
Hello Everyone!
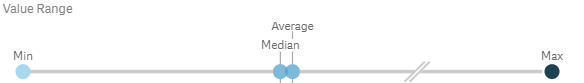
How can I get a graph just like the one in Qlik Sense's Data Management Profiling (Data Manager ==> Select Table ==> select pen shaped Icon ==> select any column). it Auto creates a Summary sheet and this sheet has a value range which I'd like to get. Any ideas?
Thanks!
- Mark as New
- Bookmark
- Subscribe
- Mute
- Subscribe to RSS Feed
- Permalink
- Report Inappropriate Content
Hello mate!
The value range area is a group of 4 functions that are applied on the column you select.
You can represent that in different formats (KPIs, Texts...) but the 4 functions are:
Min(column_name)
Max(column_name)
Median(column_name)
Avg(column_name)
For apply this functions you only need to add a measure on the chart you want to use. When you´ll add a measure it will ask you for choose the field you want to use and instead of choose press the function button (that appears as a fx icon) and write all the functions I wrote you above (remember to change the name of the column) and then press apply button.
After add each measure with his own function you will see the values you wanted.
I hope that helps you to get what you wants.
Regards,
Ricardo
- Mark as New
- Bookmark
- Subscribe
- Mute
- Subscribe to RSS Feed
- Permalink
- Report Inappropriate Content
Thanks but the attached graph is what I have in mind.
- Mark as New
- Bookmark
- Subscribe
- Mute
- Subscribe to RSS Feed
- Permalink
- Report Inappropriate Content