Unlock a world of possibilities! Login now and discover the exclusive benefits awaiting you.
- Qlik Community
- :
- Forums
- :
- Analytics
- :
- App Development
- :
- Graph combined with line, stacked bars and data la...
Options
- Subscribe to RSS Feed
- Mark Topic as New
- Mark Topic as Read
- Float this Topic for Current User
- Bookmark
- Subscribe
- Mute
- Printer Friendly Page
Turn on suggestions
Auto-suggest helps you quickly narrow down your search results by suggesting possible matches as you type.
Showing results for
Contributor
2018-09-06
03:15 PM
- Mark as New
- Bookmark
- Subscribe
- Mute
- Subscribe to RSS Feed
- Permalink
- Report Inappropriate Content
Graph combined with line, stacked bars and data label displayed on both bars
Hello everyone!!
I have a question, I need to create a chart with three characteristics:
- Graph combining rows and bars
- The bars should be stacked
- I should be able to display the label of the ranges that make up the column / bars.
An example graphic follows below, however what is missing are the labels of the blue and red bars. Currently I can only display the total of the two bars.
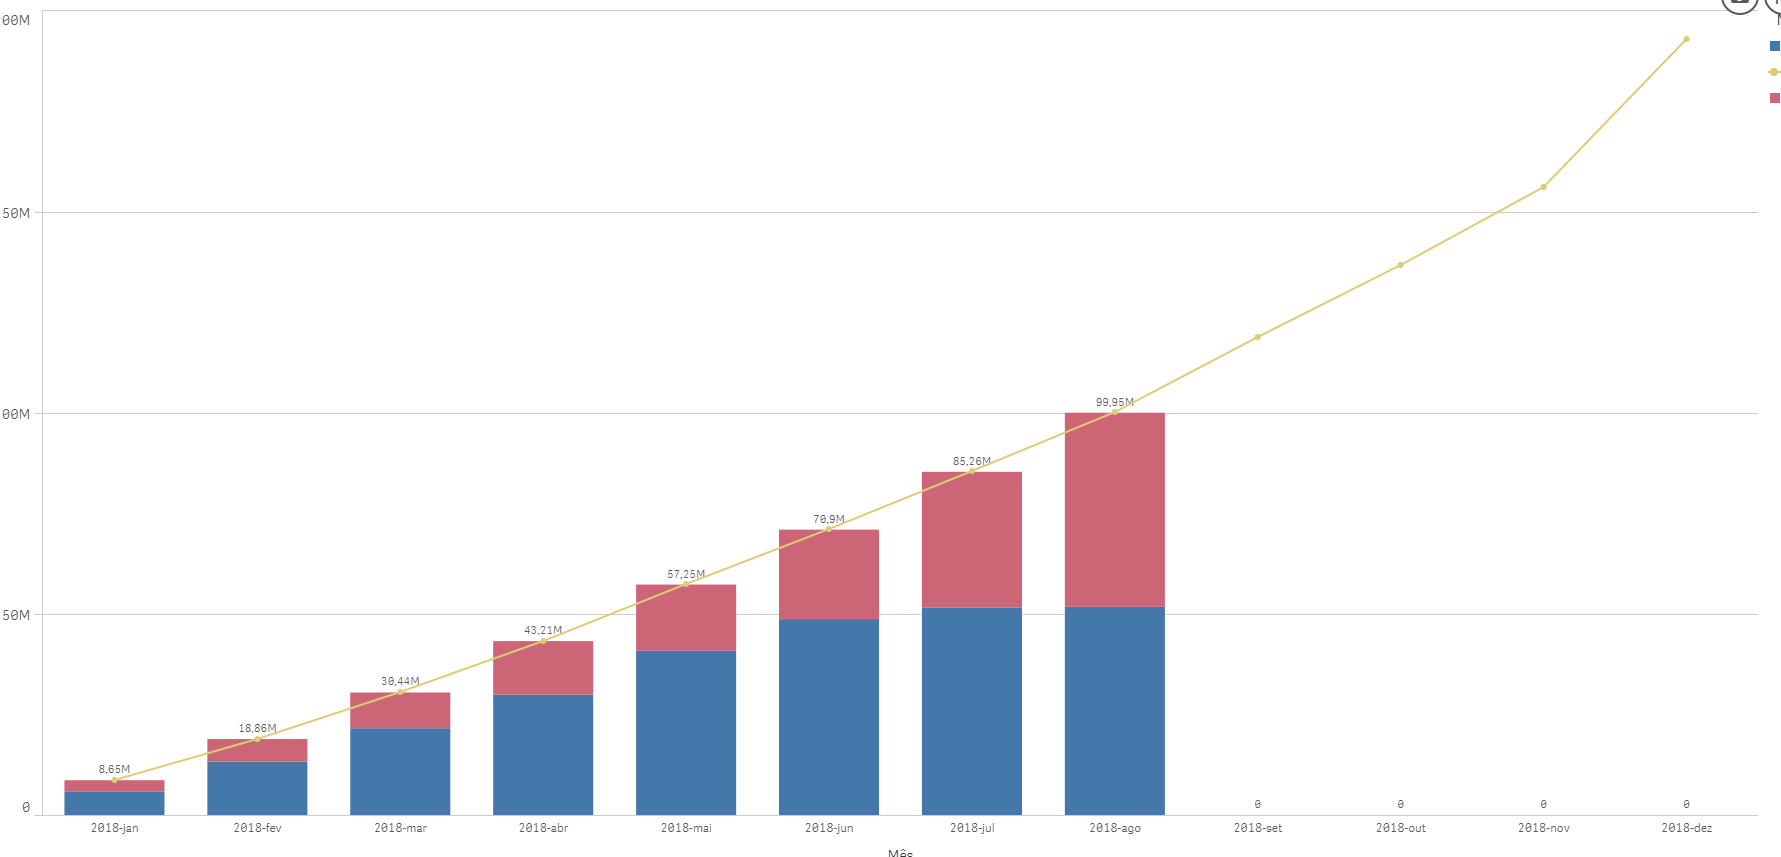
Does anyone know how to achieve this? And yet, does anyone know why this is not native to Qlik Sense? Is something very unusual this need to the point of not being implemented?
Cheers
298 Views
0 Replies
Community Browser