Unlock a world of possibilities! Login now and discover the exclusive benefits awaiting you.
- Qlik Community
- :
- Forums
- :
- Analytics
- :
- App Development
- :
- Growth versus previous year
- Subscribe to RSS Feed
- Mark Topic as New
- Mark Topic as Read
- Float this Topic for Current User
- Bookmark
- Subscribe
- Mute
- Printer Friendly Page
- Mark as New
- Bookmark
- Subscribe
- Mute
- Subscribe to RSS Feed
- Permalink
- Report Inappropriate Content
Growth versus previous year
Dear QV community,
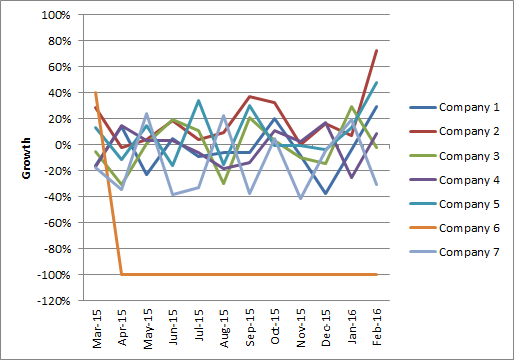
I'm trying to do the below graph representing the growth of the month versus the same month last year.
I have been trying the function above but it is calculating the growth versus previous month.
Any help
I attached my samples database for reference
- Tags:
- growth
- Mark as New
- Bookmark
- Subscribe
- Mute
- Subscribe to RSS Feed
- Permalink
- Report Inappropriate Content
May be this:
Script:
Table:
LOAD Date,
MonthName(Date) as MonthYear,
Account,
Salesman,
Company,
Brand,
Pack,
Market,
Box,
Pack1,
EUR
FROM
[test 2 (2).xlsx]
(ooxml, embedded labels, table is Sheet1);
LinkTable:
LOAD Distinct
MonthYear as LinkMonthYear,
MonthYear,
'CY' as Flag
Resident Table;
Concatenate (LinkTable)
LOAD Distinct
MonthYear as LinkMonthYear,
MonthName(AddYears(MonthYear, -1)) as MonthYear,
'PY' as Flag
Resident Table;
Line Chart
Dimension: LinkMonthYear and Company
Expression: =Sum({<Flag = {'CY'}>}EUR)/Sum({<Flag = {'PY'}>}EUR) - 1
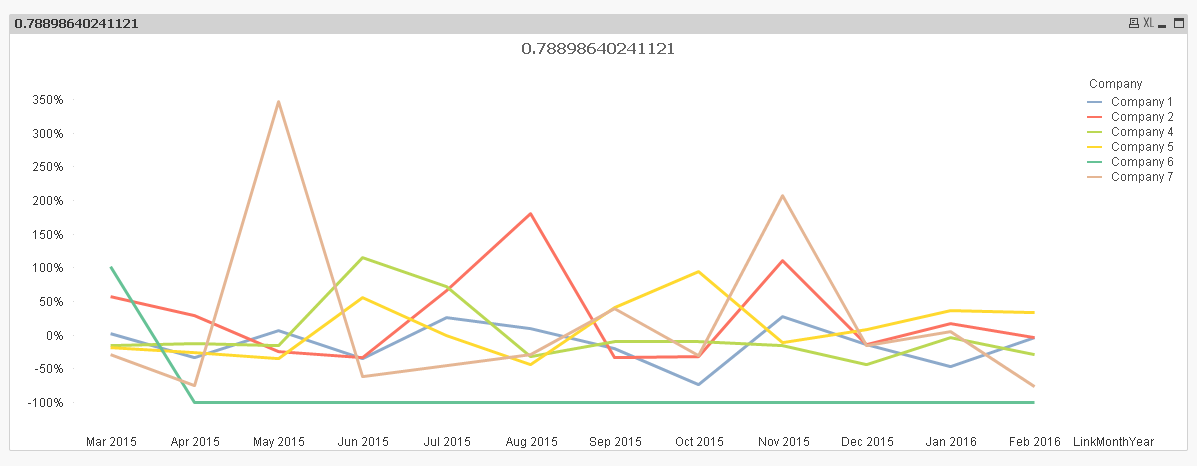
UPDATE: I had to exclude Company 3 from the selections because it was skewing the results due to one very high percentage.