Unlock a world of possibilities! Login now and discover the exclusive benefits awaiting you.
- Qlik Community
- :
- Forums
- :
- Analytics
- :
- App Development
- :
- HELP
- Subscribe to RSS Feed
- Mark Topic as New
- Mark Topic as Read
- Float this Topic for Current User
- Bookmark
- Subscribe
- Mute
- Printer Friendly Page
- Mark as New
- Bookmark
- Subscribe
- Mute
- Subscribe to RSS Feed
- Permalink
- Report Inappropriate Content
HELP
I have two tables:
the first contains the following data:
- date of creation, user, seller, client code, status, number, CA
the second data : Customer code, social reason, seller,
State
Zip code
The State column includes: customer, Prospect, inactive
How can I get the amount of quotes for the prospects only?
How can I present these same graphics by freezing it for a quarter?
Thank you for your help
- Mark as New
- Bookmark
- Subscribe
- Mute
- Subscribe to RSS Feed
- Permalink
- Report Inappropriate Content
Bruno,
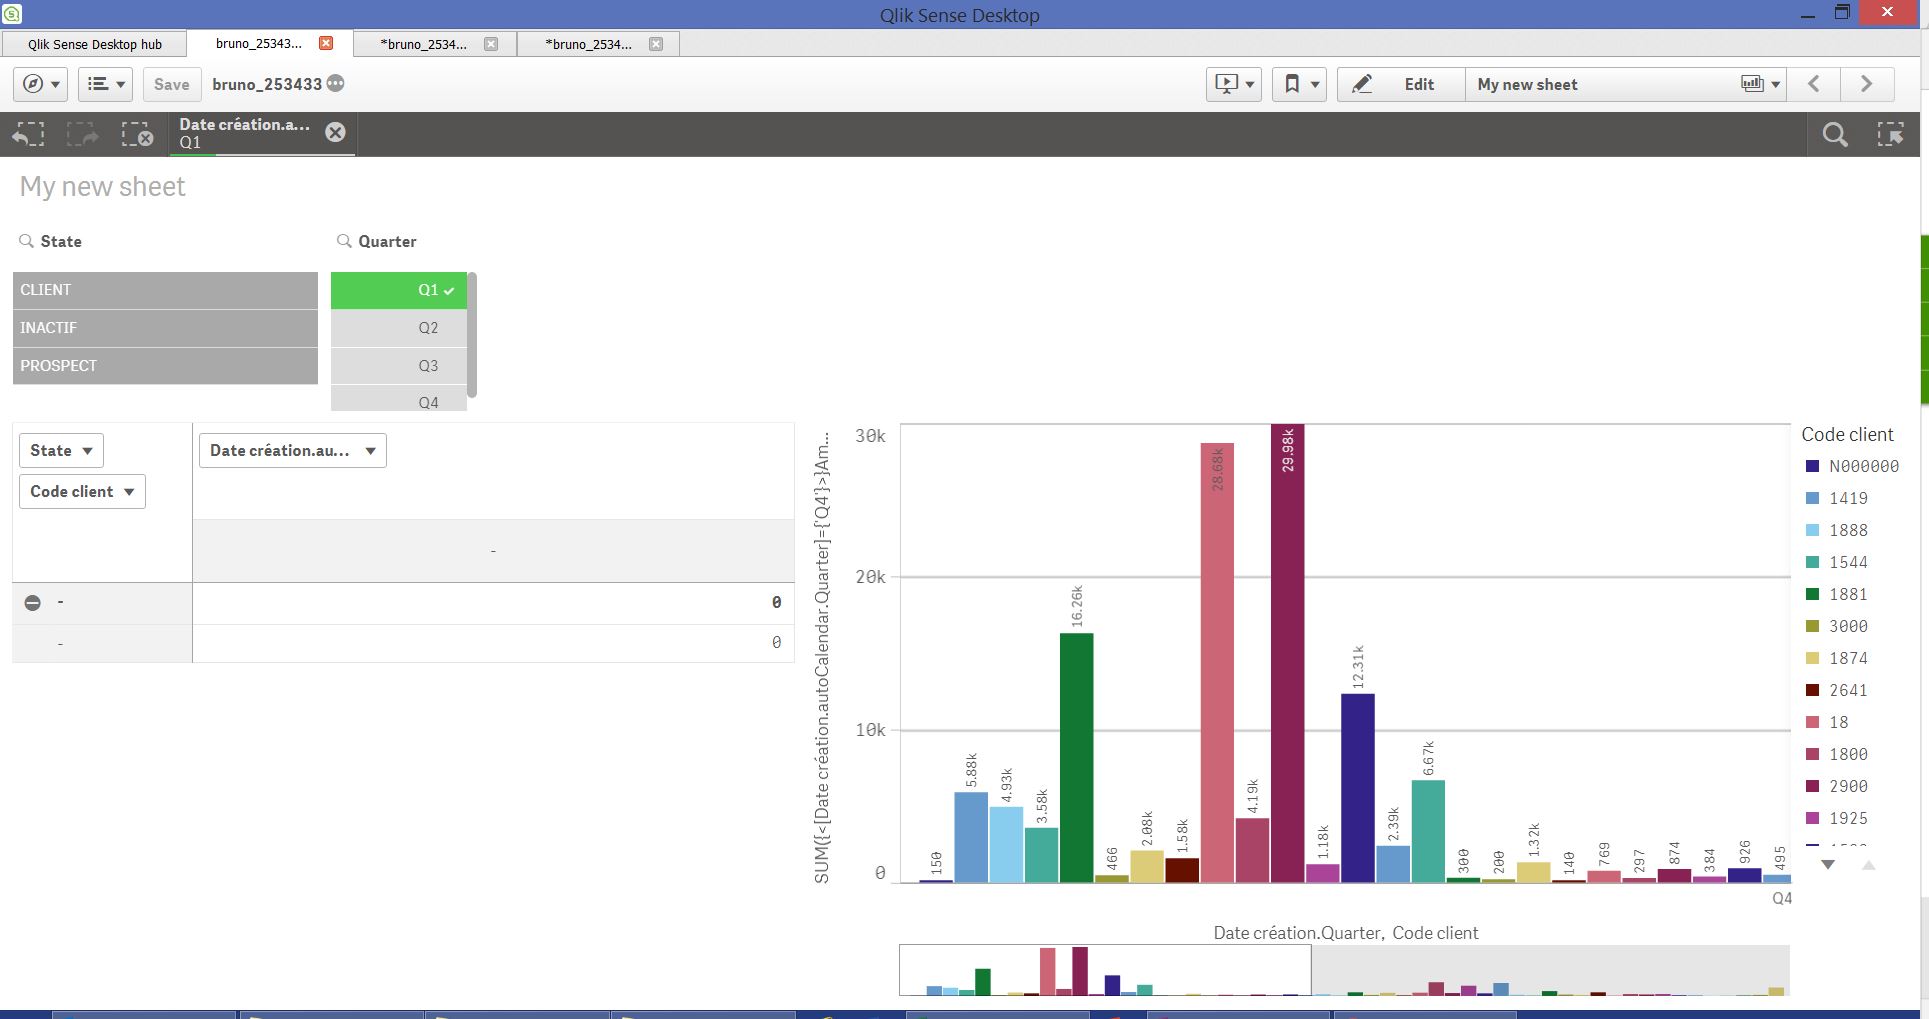
For amount for prospects only I would do the following - Import both the tables and associate client code column from both the tables either by a direct join during load or by drag-n-drop in the model viewer. then make a pivot table using client code as rows and state as columns with amount as measure. When I do that, I see no value for the Prospect category. I checked the raw data back into the Excel (Not to doubt Qlik but myself) and there is no amount information available for those client codes as well as any quarters other than Q4. You probably want to bring in more complete data and if this is all your data, then there is no amount for Prospect category and no data for any month other than October (4th quarter)
If you do the data import using the data manager, it would create multiple timeline dimensions including quarter based on the date value in your data. This you can use in a set analysis expression like this -
SUM({<[Date création.autoCalendar.Quarter]={'Q4'}>}Amount)
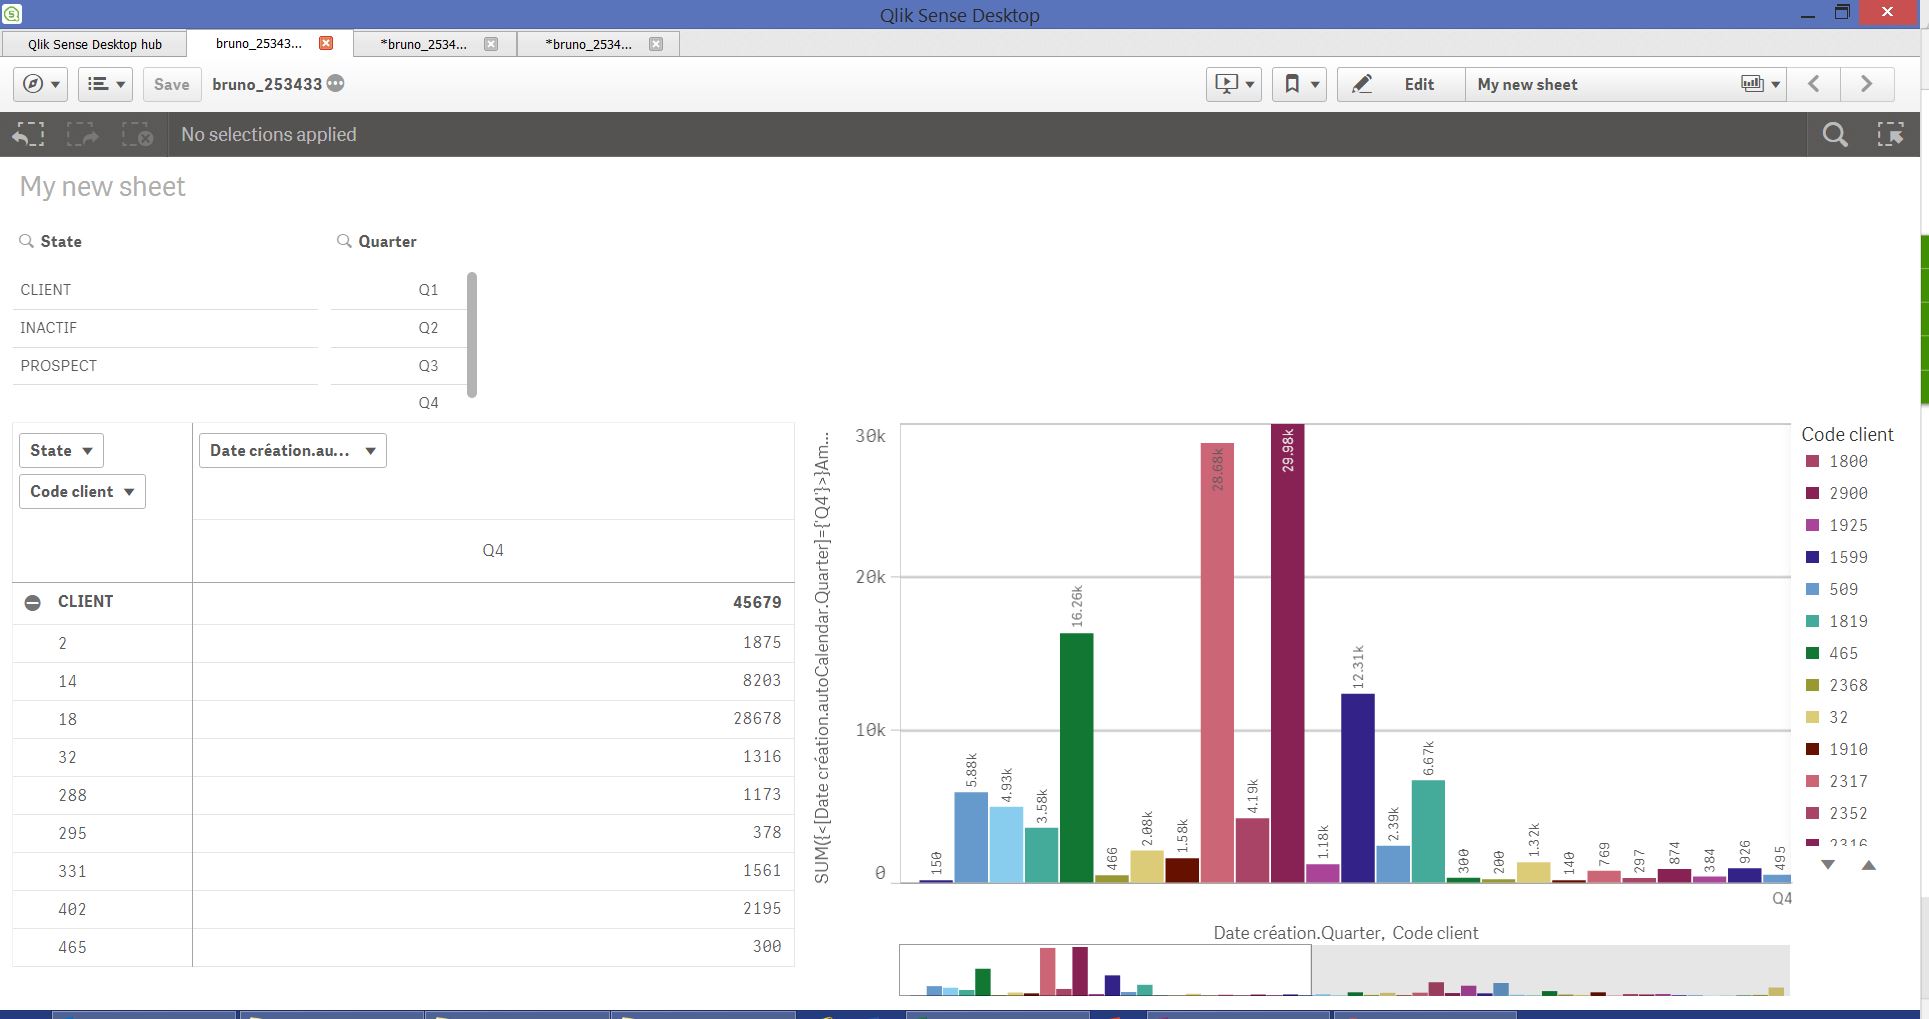
Note that the chart on right remains is forced fixed to Q4 as an example.
Hope this helps,
Thanks,
Ajit