Unlock a world of possibilities! Login now and discover the exclusive benefits awaiting you.
- Qlik Community
- :
- Forums
- :
- Analytics
- :
- App Development
- :
- Help with Running Total in Line Chart
- Subscribe to RSS Feed
- Mark Topic as New
- Mark Topic as Read
- Float this Topic for Current User
- Bookmark
- Subscribe
- Mute
- Printer Friendly Page
- Mark as New
- Bookmark
- Subscribe
- Mute
- Subscribe to RSS Feed
- Permalink
- Report Inappropriate Content
Help with Running Total in Line Chart
First time post, long time viewer.
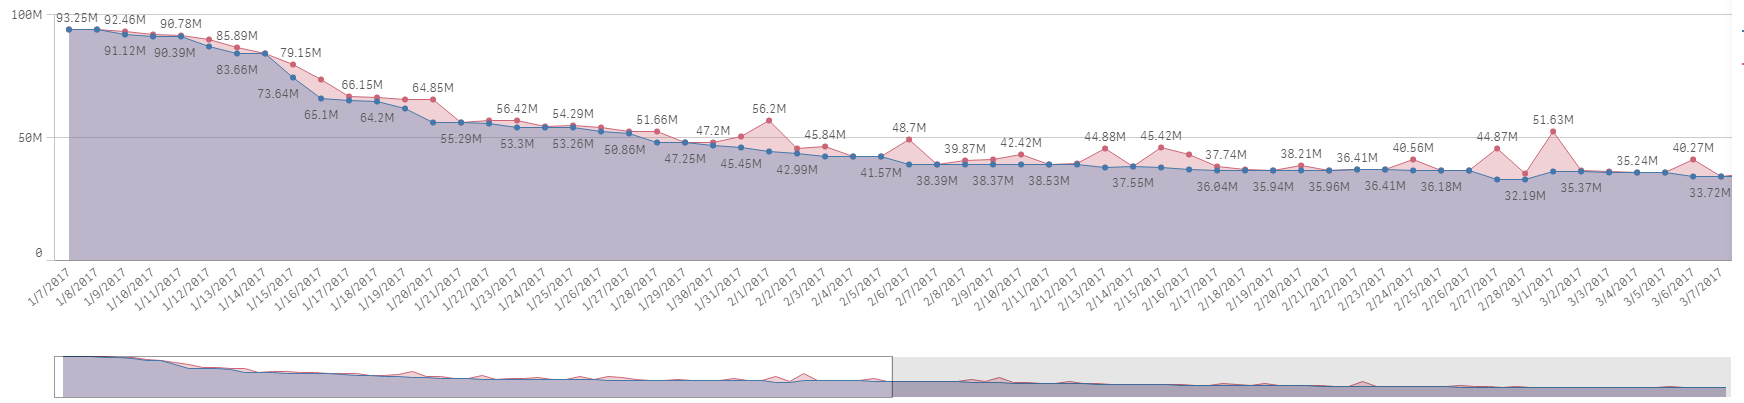
Hey everyone, I've been getting advice from you great people for awhile, but now I have an issue that's a little more specific to my environment. I have an inventory system which has about 60k parts in it. My goal here is I'm trying to show a sum of the running total of part quantity on hand, with the addition of purchase orders and the subtraction of sales orders related to these parts. I'm trying to put this into a line chart, with the ReqDate as the dimension, so I can see when inventory is going up and down.
It may be a little easier if I explain like this:
Table1_OH:
Partno Qty -(This is loading on hand amount in system)
A 30
B 25
C 50
Table2_SO:
SalesOrder Partno Qty ReqDate -(Date Qty will be subtracted from Running Total)
1 A 10 1/22/2017
2 B 5 1/17/2017
3 C 20 2/03/2017
Table3_PO:
PurchaseOrder Partno Qty ReqDate -(Date Qty will be Added to Running Total)
1 A 5 2/14/2017
2 B 15 2/05/2017
3 C 25 3/12/2017
Now obviously my data is on a much bigger scale, but the premise is mostly the same. I believe I have an issue with there being no ReqDate associated when I load the Table1_OH. I've tried load Date(today()) as reqdate on that table and using RangeSum function in line chart, but then the on hand sums go whacky on dates where Sales Orders or Purchase Orders hit the system.
Sorry guys, I know this is lengthy. I can upload a sample of what I've got if anyone needs.
Thanks in advance!
- « Previous Replies
-
- 1
- 2
- Next Replies »
- Mark as New
- Bookmark
- Subscribe
- Mute
- Subscribe to RSS Feed
- Permalink
- Report Inappropriate Content
Check top right table of attached app. Notice how measures are all null. Now filter for part 50-46PQ and then you start seeing the dates and cumulative values where it's < 0. Even thought part is a column, it doesn't group by part unless you select one.
Keeping the filter on, notice how measure 2 now shows up in the line chart, but it doesn't when there is no part filter selected.
- Mark as New
- Bookmark
- Subscribe
- Mute
- Subscribe to RSS Feed
- Permalink
- Report Inappropriate Content
I think the chart on the top right can be fixed using this?
If(Only({<reqdate = {"=reqdate < Date(Today()+120)"}>} Aggr(RangeSum(Above(
RangeSum(
Sum({<reqdate>}Aggr(Sum({<reqdate>} DISTINCT OH), row1)),
Sum({<reqdate>}Aggr(Sum({<reqdate>} DISTINCT qtyord), purno)),
-Sum({<reqdate>} Aggr(Sum({<reqdate>}DISTINCT qtyneed), wono))
), 0, RowNo())), partno, (reqdate,(Numeric, Ascending)))) < 0,
Only({<reqdate = {"=reqdate < Date(Today()+120)"}>} Aggr(RangeSum(Above(
RangeSum(
Sum({<reqdate>}Aggr(Sum({<reqdate>} DISTINCT OH), row1)),
Sum({<reqdate>}Aggr(Sum({<reqdate>} DISTINCT qtyord), purno)),
-Sum({<reqdate>} Aggr(Sum({<reqdate>}DISTINCT qtyneed), wono))
), 0, RowNo())), partno, (reqdate,(Numeric, Ascending)))))
But how that play a role in the main chart, I still don't understand.... but may be this....
RangeSum(Column(1),
Sum({<reqdate = {"=reqdate < Date(Today()+120)"}>}Aggr(If(RangeSum(Above(
RangeSum(
Sum({<reqdate>}Aggr(Sum({<reqdate>} DISTINCT OH), row1)),
Sum({<reqdate>}Aggr(Sum({<reqdate>} DISTINCT qtyord), purno)),
-Sum({<reqdate>} Aggr(Sum({<reqdate>}DISTINCT qtyneed), wono))
), 0, RowNo())) < 0,
RangeSum(Above(
RangeSum(
Sum({<reqdate>}Aggr(Sum({<reqdate>} DISTINCT OH), row1)),
Sum({<reqdate>}Aggr(Sum({<reqdate>} DISTINCT qtyord), purno)),
-Sum({<reqdate>} Aggr(Sum({<reqdate>}DISTINCT qtyneed), wono))
), 0, RowNo()))), partno, (reqdate,(Numeric, Ascending)))) * -1)
- Mark as New
- Bookmark
- Subscribe
- Mute
- Subscribe to RSS Feed
- Permalink
- Report Inappropriate Content
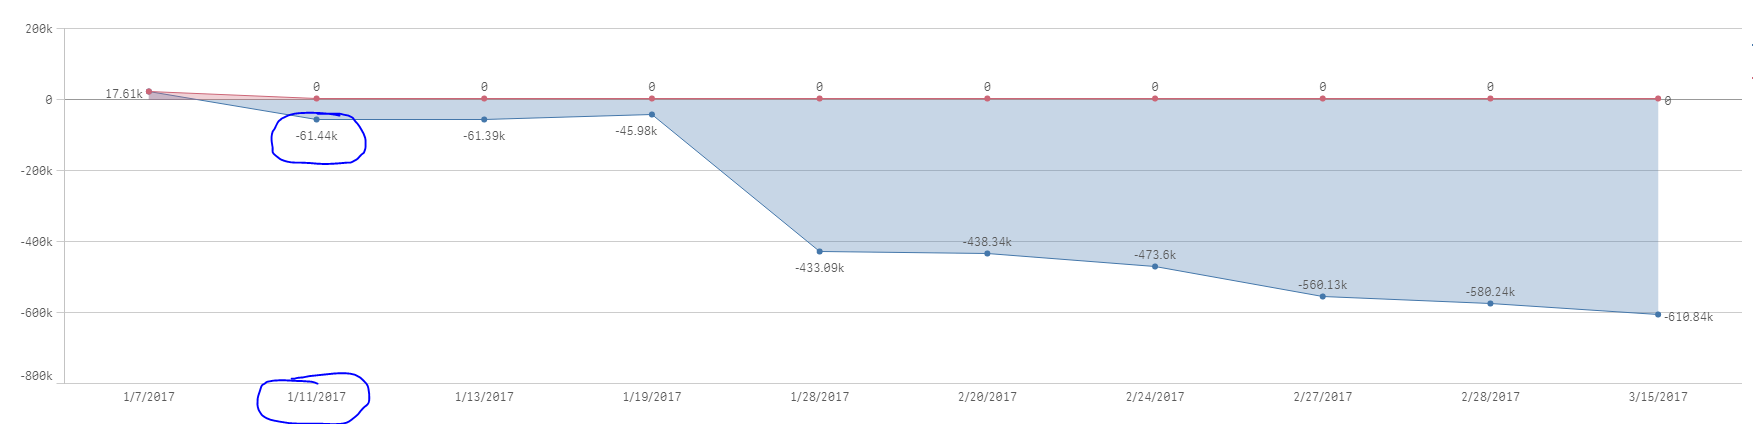
Afraid that still didn't fix it. If you filter for part 50-46PQ, you see that there's a negative value at 1/11/2017, but if we export the table with no filter, search for the same part, there is no negative value on this date.
My goal for the 2nd measure is to use the cumulative total for the sum of all parts, which is measure1, and then look at every individual part on every date, and if any individual part has a cumulative qty of < 0, I want to take that qty, times it by -1, and then add it to the cumulative total on that date.
That will make measure1 show the cumulative and measure2 show what should be the cumulative total if we're to meet all the part demands. I hope this clarifies things a little further. I really do appreciate all your help (:
- Mark as New
- Bookmark
- Subscribe
- Mute
- Subscribe to RSS Feed
- Permalink
- Report Inappropriate Content
I see a negative value for part 50-46 PQ, is this not right?
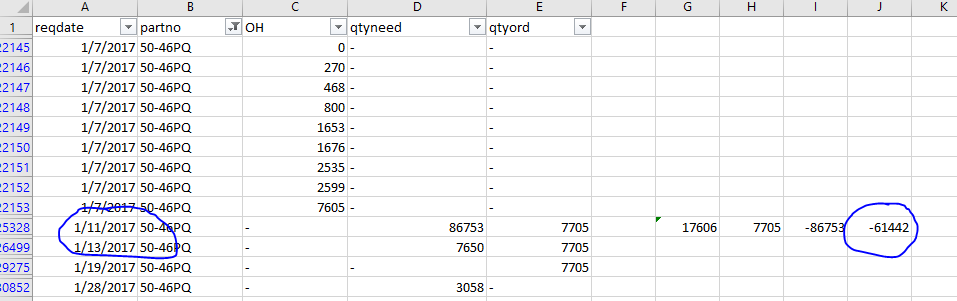
What am I missing here? Attaching the Excel file, may be you can show me what you want in the Excel file.
- Mark as New
- Bookmark
- Subscribe
- Mute
- Subscribe to RSS Feed
- Permalink
- Report Inappropriate Content
When you get time, add me as a connection or send me a private message. I have added you as a connection which gives you the option to see me private message, but since you are not my connection, I cannot send you a private message.
Best,
Sunny
- Mark as New
- Bookmark
- Subscribe
- Mute
- Subscribe to RSS Feed
- Permalink
- Report Inappropriate Content
I've made much progress with the app, but ran into an issue here. If you filter for Formula, measure2 should flatline at 0 once it starts going into the negatives, but unfortunately it keeps trickling down with it. However, if you remove partno from measure2, that you added in your last expression, it works as it should, but then it doesn't work for the cumulative sum if you remove the filter.
- Mark as New
- Bookmark
- Subscribe
- Mute
- Subscribe to RSS Feed
- Permalink
- Report Inappropriate Content
Can you try the attached... don't like the solution, but I think the way you have structured your whole requirement, this is the best I can do.... 
- « Previous Replies
-
- 1
- 2
- Next Replies »