Unlock a world of possibilities! Login now and discover the exclusive benefits awaiting you.
- Qlik Community
- :
- Forums
- :
- Analytics
- :
- App Development
- :
- Help with bar chart
Options
- Subscribe to RSS Feed
- Mark Topic as New
- Mark Topic as Read
- Float this Topic for Current User
- Bookmark
- Subscribe
- Mute
- Printer Friendly Page
Turn on suggestions
Auto-suggest helps you quickly narrow down your search results by suggesting possible matches as you type.
Showing results for
Partner - Creator II
2017-11-08
04:14 PM
- Mark as New
- Bookmark
- Subscribe
- Mute
- Subscribe to RSS Feed
- Permalink
- Report Inappropriate Content
Help with bar chart
Hi experts
It is possible to make a chart like this?
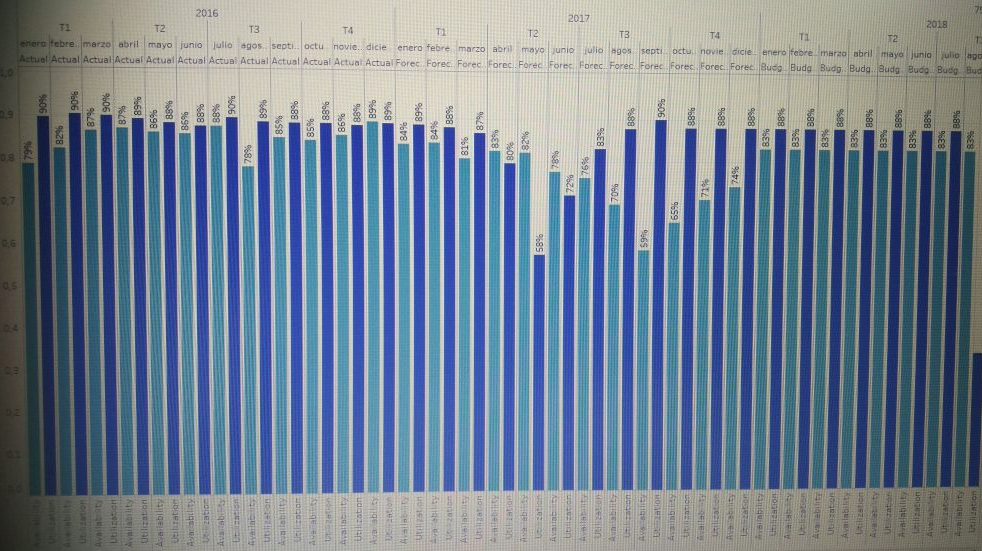
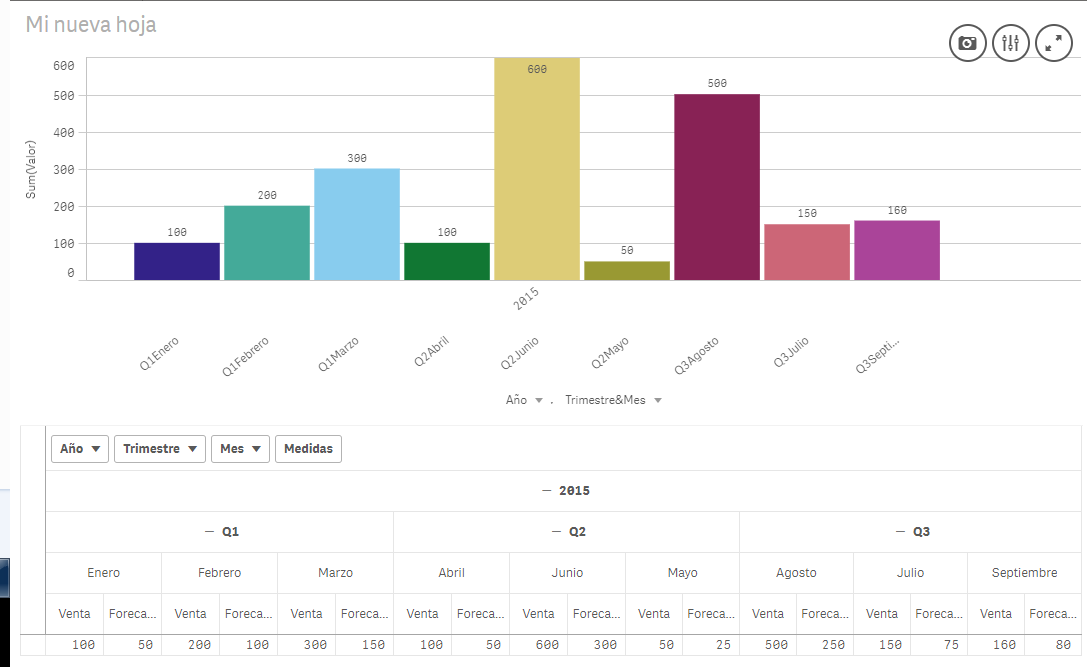
I have tried this...
Anyone knows some extension or a way to get this done?
(I use this script
T:
Load * Inline [Año,Trimestre,Mes,Valor
2015,Q1,Enero,100
2015,Q1,Febrero,200
2015,Q1,Marzo, 300
2015,Q2,Abril,100
2015,Q2,Mayo,50
2015,Q2,Junio,600
2015,Q3,Julio,150
2015,Q3,Agosto,500
2015,Q3,Septiembre,160
];
)
So much thanks
- Tags:
- bar chat
389 Views
1 Reply
Partner - Master III
2017-11-09
01:09 AM
- Mark as New
- Bookmark
- Subscribe
- Mute
- Subscribe to RSS Feed
- Permalink
- Report Inappropriate Content
I don't think it is possible
339 Views
Community Browser