Unlock a world of possibilities! Login now and discover the exclusive benefits awaiting you.
- Qlik Community
- :
- Forums
- :
- Analytics
- :
- App Development
- :
- Help with coloring using a ranked dimension
- Subscribe to RSS Feed
- Mark Topic as New
- Mark Topic as Read
- Float this Topic for Current User
- Bookmark
- Subscribe
- Mute
- Printer Friendly Page
- Mark as New
- Bookmark
- Subscribe
- Mute
- Subscribe to RSS Feed
- Permalink
- Report Inappropriate Content
Help with coloring using a ranked dimension
Hi,
This is my data set:
One table with Customers, Years, Sales Regions, Business Areas and their Revenue (see attached Sales.xlsx).
This is my goal:
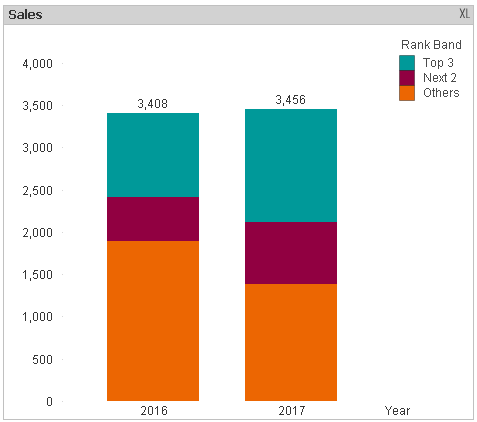
Building a stacked bar chart with one bar per year. Each stack represents the Top 3, Top 4+5 and Others customers based on their revenue in 2017.
In other words, I want to determine the Top 3 customers based on their revenue in 2017 and then also show their combined revenue in 2016, even if they would not be the Top 3 in that year.
I was able to put together a formula for the dimension that works:
=Aggr( If(Rank(Aggr(Sum({<Year={2017}>} Revenue),[Customer ID])) <= 3, Dual('Top 3',3),
       If(Rank(Aggr(Sum({<Year={2017}>} Revenue),[Customer ID])) <= 5, Dual('Next 2',5),
       Dual('Others',99)))
,[Customer ID])
And finally my problem:
I can't see to find the correct formula for defining the colors for the three bands.
In Sense, everything is displayed in gray. Playing around with the formula above only affects the stacks for 2016.
I also attached the app, hoping that someone can solve this.
Btw., I tried the same in QlikView and although QlikView is displaying colors, I cannot manually overwrite them nor are they persistent (even using the option in the Color tab)