Unlock a world of possibilities! Login now and discover the exclusive benefits awaiting you.
- Qlik Community
- :
- Forums
- :
- Analytics
- :
- App Development
- :
- Hide a dimension on a graphic
- Subscribe to RSS Feed
- Mark Topic as New
- Mark Topic as Read
- Float this Topic for Current User
- Bookmark
- Subscribe
- Mute
- Printer Friendly Page
- Mark as New
- Bookmark
- Subscribe
- Mute
- Subscribe to RSS Feed
- Permalink
- Report Inappropriate Content
Hide a dimension on a graphic
Hi every body,
I'm novice in Qlik Sense and i have a problem:
I want hide a dimension on my graphic, look this picture
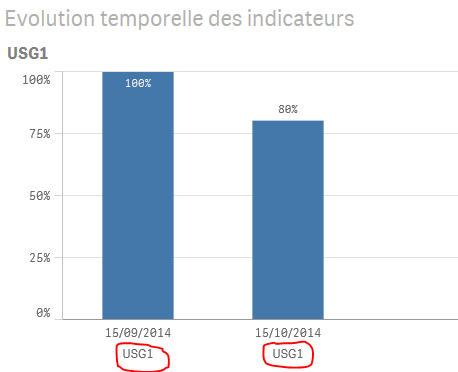
I have 2 dimensions on my X-axis.
I want hide the USG1 dimension but I want keep the Date dimension.
I tried in Appearence/X-axis/Label and title/ but my problem didn't solved.
Someone know how do that please?
Thank you for your help,
- « Previous Replies
-
- 1
- 2
- Next Replies »
Accepted Solutions
- Mark as New
- Bookmark
- Subscribe
- Mute
- Subscribe to RSS Feed
- Permalink
- Report Inappropriate Content
I found it,
Show the correct expression to show the dimension name on the graphic:
IF([Indicateurs]='USG1','')
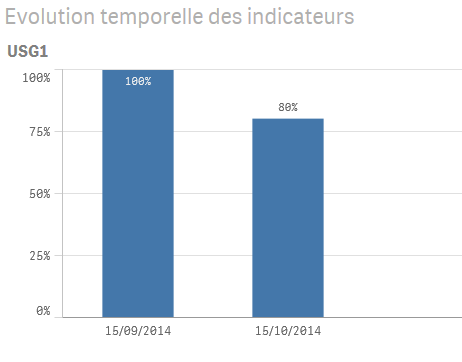
Thank you very much guys
- Mark as New
- Bookmark
- Subscribe
- Mute
- Subscribe to RSS Feed
- Permalink
- Report Inappropriate Content
Hi Jamaal,
You can try to uncheck the 'show Legend' mark in the dimension tab.
or
You can remove dimension and use set analysis in the expression. (adding to the expression something like ... {<USGField={'USG1'}>}.... )
- Mark as New
- Bookmark
- Subscribe
- Mute
- Subscribe to RSS Feed
- Permalink
- Report Inappropriate Content
Hi Jamaal -
It seems that the labels and titles - are tied together when grouped on the same Axis
- what would be helpful is if you can control the labels individually for each dimension in the grouped X-Axis
I will submit this as an enhancement request.
Let me know if you find a work-around.
Hi Ruben - can you elaborate on the Set Analysis solution you mentioned?
Mike
Mike Tarallo
Qlik
- Mark as New
- Bookmark
- Subscribe
- Mute
- Subscribe to RSS Feed
- Permalink
- Report Inappropriate Content
thank for your answer, i have this expression for my dimension:
IF(Indicateurs='USG1',Indicateurs)
when i modify like you say me i have error in expression:
IF({<Indicateurs={'USG1'}>},Indicateurs)
- Mark as New
- Bookmark
- Subscribe
- Mute
- Subscribe to RSS Feed
- Permalink
- Report Inappropriate Content
Try this:
IF([Indicateurs]='USG1','Indicateurs') - I assume you want Indicateurs to be a value? So it needs to be wrapped in single quotes. Also for an IF statement like this - you do not need to use the Set Analysis syntax using the {} and <>.
But this expressions will still show the values along the bottom - instead of showing USG1 it will just show Indicateurs - which is not what you originally asked for. Just making sure.
Mike
Mike Tarallo
Qlik
- Mark as New
- Bookmark
- Subscribe
- Mute
- Subscribe to RSS Feed
- Permalink
- Report Inappropriate Content
hi Michael,
Thanks for your answer, but my i used this expression :
IF(Indicateurs='USG1',Indicateurs)
for my graphic and he works but i tried the Ruben syntaxe and he doesn't work.
However i think Ruben is on the good way because the solution maybe found in the dimension expression to hide it on the graphic.
- Mark as New
- Bookmark
- Subscribe
- Mute
- Subscribe to RSS Feed
- Permalink
- Report Inappropriate Content
OK great - let us know and provide screen shots and solution syntax if you get it working.
Please mark the appropriate replies as helpful / correct so our team and other members know that your question(s) has been answered to your satisfaction.
Regards,
Mike
Mike Tarallo
Qlik
- Mark as New
- Bookmark
- Subscribe
- Mute
- Subscribe to RSS Feed
- Permalink
- Report Inappropriate Content
I found it,
Show the correct expression to show the dimension name on the graphic:
IF([Indicateurs]='USG1','')
Thank you very much guys
- Mark as New
- Bookmark
- Subscribe
- Mute
- Subscribe to RSS Feed
- Permalink
- Report Inappropriate Content
Nice!
Mike Tarallo
Qlik
- Mark as New
- Bookmark
- Subscribe
- Mute
- Subscribe to RSS Feed
- Permalink
- Report Inappropriate Content
If you remove the Indicateurs dimension, you need to use set analysis in the expression so only USG1 indicateur is calculated, ie:
Supossing an expresion like
Sum(Values)
the set analysis expression should be:
Sum({<Indicateurs={'USG1'}>} Values)
That's for expressions, not for the "expression for your dimension", if you uses set analysis on dimension, the dimension will still be shown on the X-axis, you need to remove Indicateurs dimension.
If you need or want to keep the Indicateurs dimension... have you tried to uncheck the 'Show legend' mark?
- « Previous Replies
-
- 1
- 2
- Next Replies »