Unlock a world of possibilities! Login now and discover the exclusive benefits awaiting you.
- Qlik Community
- :
- Forums
- :
- Analytics
- :
- App Development
- :
- Hide months where there are no values in accumulat...
- Subscribe to RSS Feed
- Mark Topic as New
- Mark Topic as Read
- Float this Topic for Current User
- Bookmark
- Subscribe
- Mute
- Printer Friendly Page
- Mark as New
- Bookmark
- Subscribe
- Mute
- Subscribe to RSS Feed
- Permalink
- Report Inappropriate Content
Hide months where there are no values in accumulated sales graph
Hello,
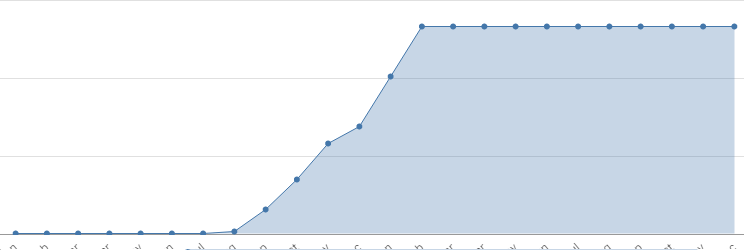
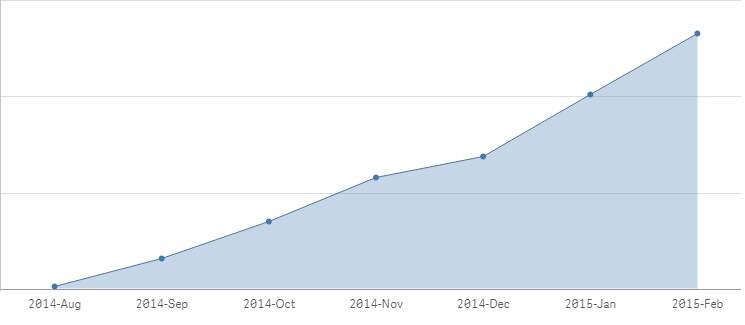
I was making an accumulated sales graph. After creating a time dimension the graph appears like the following. Before the time dimension it was like the second graph. There are some months in which there are no sales and they appear. like the first ones, they show a 0. It also keeps showing the graph till the last month in the time dimension but I want to show only until the last month where there was any sale.
When there's no selection it appears the next graph:
When I select all the clients, the graph appears properly:
Cheers,
- Mark as New
- Bookmark
- Subscribe
- Mute
- Subscribe to RSS Feed
- Permalink
- Report Inappropriate Content
What is the expression you are using? Would you be able to share a sample?
- Mark as New
- Bookmark
- Subscribe
- Mute
- Subscribe to RSS Feed
- Permalink
- Report Inappropriate Content
This is the expression I'm using:
RangeSum(
Above( SUM(Sales), 0, NoOfRows() )
)
- Mark as New
- Bookmark
- Subscribe
- Mute
- Subscribe to RSS Feed
- Permalink
- Report Inappropriate Content
Hi Danial,
Try this:
There is a property where you can hide Zeros in the data handling section in the properties pane. Check that box to eliminate the Zeros.