Unlock a world of possibilities! Login now and discover the exclusive benefits awaiting you.
- Qlik Community
- :
- Forums
- :
- Analytics
- :
- App Development
- :
- Histogram containing multiple subsets
- Subscribe to RSS Feed
- Mark Topic as New
- Mark Topic as Read
- Float this Topic for Current User
- Bookmark
- Subscribe
- Mute
- Printer Friendly Page
- Mark as New
- Bookmark
- Subscribe
- Mute
- Subscribe to RSS Feed
- Permalink
- Report Inappropriate Content
Histogram containing multiple subsets
Hello all,
I would like to visualize data containing specific & repeated values
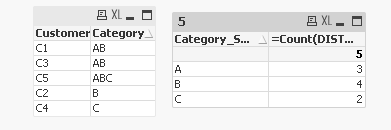
| Customer | Category |
|---|---|
| C1 | AB |
| C2 | B |
| C3 | AB |
| C4 | C |
| C5 | ABC |
The expected result is a histogram with the folowing data:
A => 3 customers (C1, C3 and C5)
B=> 4 customers
C=> 2 customers
I would like this histogram to have selectable fields in order to filter the data easily.
Functions like "valuelist" doesn't work because it is not possible to filter the data. It might be possible with new independent set of data but I don't know how to implement them.
This is a quite simple request but I didn't found any solution yet 
Many thanks in advance,
NM
- Mark as New
- Bookmark
- Subscribe
- Mute
- Subscribe to RSS Feed
- Permalink
- Report Inappropriate Content
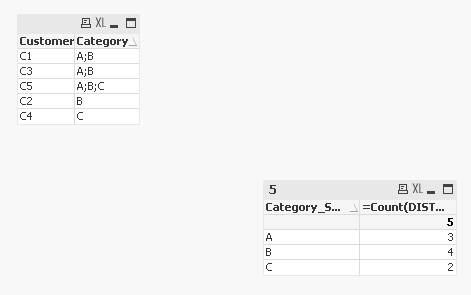
Do you have a character between individual category? Assuming that character is ;, you can try this
Table:
LOAD * INLINE [
Customer, Category
C1, A;B
C2, B
C3, A;B
C4, C
C5, A;B;C
];
LinkTable:
LOAD Distinct Category,
SubField(Category, ';') as Category_Selection
Resident Table;
- Mark as New
- Bookmark
- Subscribe
- Mute
- Subscribe to RSS Feed
- Permalink
- Report Inappropriate Content
This is a very good idea Sunny, many thanks.
however, there is no such character in the data set.
Any other proposal?
If not, I would modify the original data according to your solution but it would be better if there is another solution.
- Mark as New
- Bookmark
- Subscribe
- Mute
- Subscribe to RSS Feed
- Permalink
- Report Inappropriate Content
If category is only ever going to be a single digit thing, then may be this
Table:
LOAD * INLINE [
Customer, Category
C1, AB
C2, B
C3, AB
C4, C
C5, ABC
];
LinkTable:
LOAD Distinct Category,
Mid(Category, IterNo(), 1) as Category_Selection
Resident Table
While IterNo() <= Len(Category);