Unlock a world of possibilities! Login now and discover the exclusive benefits awaiting you.
- Qlik Community
- :
- Forums
- :
- Analytics
- :
- App Development
- :
- How QVDs should be set up so that non-coders can b...
Options
- Subscribe to RSS Feed
- Mark Topic as New
- Mark Topic as Read
- Float this Topic for Current User
- Bookmark
- Subscribe
- Mute
- Printer Friendly Page
Turn on suggestions
Auto-suggest helps you quickly narrow down your search results by suggesting possible matches as you type.
Showing results for
Former Employee
2019-05-09
05:55 PM
- Mark as New
- Bookmark
- Subscribe
- Mute
- Subscribe to RSS Feed
- Permalink
- Report Inappropriate Content
How QVDs should be set up so that non-coders can build apps
Qlik offers an instructor led class in data modeling. In that class you learn the best practices of scripting, and denormalizing and the like for creating well structured data - QVD files - or Data Lakes- so that non - coders - mere mortal business users - can leverage to make self - service applications. Some of my clients/students are a bit confused by the topic, and expect users to script - which is no longer necessary with Qlik Sense.
The QVD file should be completely formed so the business user does not need to perform additional transformations prior to consuming the QVD files. Some of the transformations that should have taken place on the data already include: 1. Denormalization (to reduce the number of tables and improve performance- no snowflake schemas .), 2. Renaming fields for consistency and not having two tables with the same field names for differing fields and NO phantom connections between tables. 3. Link tables to accommodate differing levels of details - eg quarterly quotas v. daily orders. 3. Master calendars - eg. addressing fiscal years, 4. Classifying data - eg. grouping customers by gen X v. gen Y. 5. Precalculated fields - say for profitability so business users don't misinterpret the data and aren't tempted to create these on the fly in the interface. 6. Pre- thought out connections - use of left joins and composite keys to avoid synthetic keys and circular references when multiple tables are created. 7. Cross tables are avoided so that items like 'Month' don't consume a new field each period.
Once QVDs are well formed the business user can build visualizations by connecting to the data and never having to create script. They can be directed to load from a QVD and service their own BI needs:
-
Make sure you have content admin or root privileges.
-
There should be a folder connection like "Accounting's QVDs" that you have access to.
-
Create a new app
-
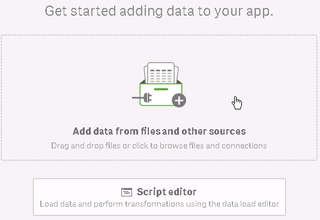
Click Add Data from files
- Click Shared files -> Your Department's QVDs
- Select the QVD that you want
- Optionally: If you want to less than all the data, deselect undesirable fields.
- Optionally: To filter the data click Filters on the Upper Right- Note: When entering dates, no quotes are needed:
- Click 'Add data'. Your tables will be loaded
- Navigate to data manager to add additional calculated fields and the like with no scripting.
- Optionally: to add additional data sources, click the plus on the upper left
- Repeat from step 5 as needed.
- Navigate to Data Load editor -> Recommended Associations to associate tables as necessary. Click Load Data
- Navigate to a new sheet, Select 'Insights' -> 'Generate insights' Qlik will suggest charts to use in your apps.
I hope this moves the conversation forward so that scripters and non scripters alike can best leverage Qlik Sense.
307 Views
0 Replies
Community Browser


