Unlock a world of possibilities! Login now and discover the exclusive benefits awaiting you.
- Qlik Community
- :
- Forums
- :
- Analytics
- :
- App Development
- :
- How can I customize the other color for Combo Char...
- Subscribe to RSS Feed
- Mark Topic as New
- Mark Topic as Read
- Float this Topic for Current User
- Bookmark
- Subscribe
- Mute
- Printer Friendly Page
- Mark as New
- Bookmark
- Subscribe
- Mute
- Subscribe to RSS Feed
- Permalink
- Report Inappropriate Content
How can I customize the other color for Combo Chart - Gauge Chart by RGB() color in Qliksense
Hi all!
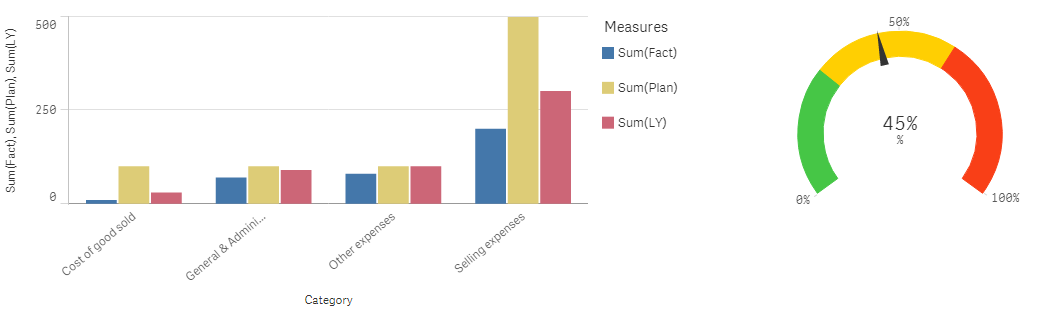
That're combo chart and gauge chart that I want to change color by RGB() color by myself.
- In that combo chart I have one Demension (Category) and three Measure (Fact, Plan, LY). I want to change color for each Measure by RGB() color. I used "By expression" to write expression to change color, but it didn't work, and the gauge chart too.
Many thanks in advance.
Regards,
Nam Nguyen
- Tags:
- qlik
- qlik sense
- sense
- Mark as New
- Bookmark
- Subscribe
- Mute
- Subscribe to RSS Feed
- Permalink
- Report Inappropriate Content
This would be nice indeed!
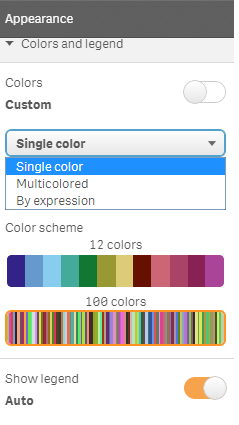
I tried several complex color expressions to "trick" a different coloring per expression, but no luck.
Strange that a custom color expression applies to all the expressions, while the option "Multicolored" for a combo chart does differentiate automatically... They should make coloring a property of the (individual) Y-axis.
- Mark as New
- Bookmark
- Subscribe
- Mute
- Subscribe to RSS Feed
- Permalink
- Report Inappropriate Content
Coloring by expression differs from the behavior when using a single color in more cases.
It doesn't make sense to me.
See this line-chart, where I use an expression to color dates before the 1st of March. Then all of a sudden the area coloring changes from a distinctive fill to a very transparent generic blur...
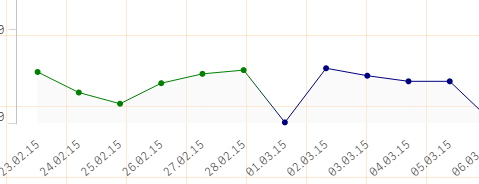
And the color function "BLUE()" is not the same blue as the blue from the single color optionbox!
And the 12 colors in the Combo chart's Multicolored schema are different from the 12 colors in the line/bar chart's single color optionbox.
Using consistent coloring, for a specific measure, throughout the application doesn't come easy.