Unlock a world of possibilities! Login now and discover the exclusive benefits awaiting you.
- Qlik Community
- :
- Forums
- :
- Analytics
- :
- App Development
- :
- How do I drill down in a bar chart?
- Subscribe to RSS Feed
- Mark Topic as New
- Mark Topic as Read
- Float this Topic for Current User
- Bookmark
- Subscribe
- Mute
- Printer Friendly Page
- Mark as New
- Bookmark
- Subscribe
- Mute
- Subscribe to RSS Feed
- Permalink
- Report Inappropriate Content
How do I drill down in a bar chart?
Good day
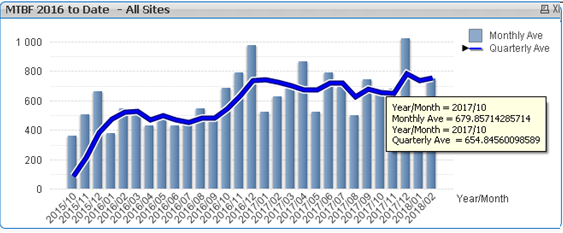
I have a bar and line chart with dates as a dimension. The bar display the monthly ave and the line the quarterly ave.
Sum({<TypeDrill={Hybrid},[MonthIndex] = {'<=$(vMaxPeriod)'}>}MetersDrilled)/sum({<TypeDrill={Hybrid},[MonthIndex] = {'<=$(vMaxPeriod)'}>}Repairs)/4
Now if I only want to see the current year's data the quarterly ave is recalculated starting at 0.
This is a misinterpretation of the data as it started at 0 in 2016.
How do i fix it?
- Mark as New
- Bookmark
- Subscribe
- Mute
- Subscribe to RSS Feed
- Permalink
- Report Inappropriate Content
Would you be able to share a sample to show the issue?
- Mark as New
- Bookmark
- Subscribe
- Mute
- Subscribe to RSS Feed
- Permalink
- Report Inappropriate Content
Good day
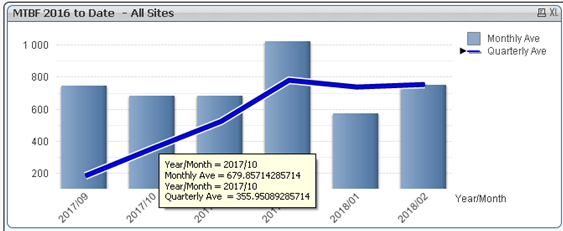
Here is my graph.
When you make a selection, it recalculates the quarterly ave as seen below from 655 to 356.
How do I stop it from recalculation. I only want to zoom in on the data for those periods.
- Mark as New
- Bookmark
- Subscribe
- Mute
- Subscribe to RSS Feed
- Permalink
- Report Inappropriate Content
You Setting a new Dimension by Group working
set the fields in the Group
()DateMonth
The Group is your new dimension
- Mark as New
- Bookmark
- Subscribe
- Mute
- Subscribe to RSS Feed
- Permalink
- Report Inappropriate Content
Would you be able to share the qvw to test?