Unlock a world of possibilities! Login now and discover the exclusive benefits awaiting you.
- Qlik Community
- :
- Forums
- :
- Analytics
- :
- App Development
- :
- How to add a Average monthly sales line on to my e...
Options
- Subscribe to RSS Feed
- Mark Topic as New
- Mark Topic as Read
- Float this Topic for Current User
- Bookmark
- Subscribe
- Mute
- Printer Friendly Page
Turn on suggestions
Auto-suggest helps you quickly narrow down your search results by suggesting possible matches as you type.
Showing results for
Master
2016-06-29
01:59 AM
- Mark as New
- Bookmark
- Subscribe
- Mute
- Subscribe to RSS Feed
- Permalink
- Report Inappropriate Content
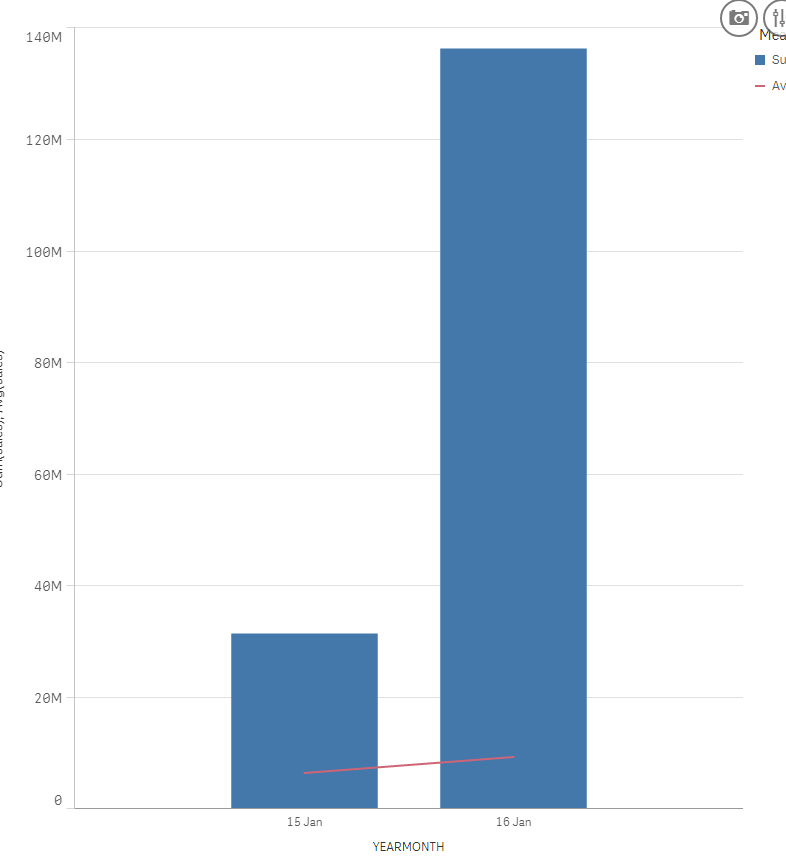
How to add a Average monthly sales line on to my existing monthly sales bar chart ?
Hi All
I have a Bar Chart in QS.
I like to add one more line to this bar chart , which show the average yearly sales. avg(sales)
Paul
318 Views
3 Replies
Master
2016-06-29
02:00 AM
Author
- Mark as New
- Bookmark
- Subscribe
- Mute
- Subscribe to RSS Feed
- Permalink
- Report Inappropriate Content
my QVF
244 Views
MVP
2016-06-29
06:04 AM
- Mark as New
- Bookmark
- Subscribe
- Mute
- Subscribe to RSS Feed
- Permalink
- Report Inappropriate Content
May be using a combo chart
244 Views
Master
2016-06-29
10:48 AM
Author
- Mark as New
- Bookmark
- Subscribe
- Mute
- Subscribe to RSS Feed
- Permalink
- Report Inappropriate Content
Hi sunny
what i need is to have the average line on the chart .
For example if i select year = 2016 , total amount of sales 1,586 , Average = 1,541/6 = 256.
May i know how to do it ?
Paul
244 Views
Community Browser