Unlock a world of possibilities! Login now and discover the exclusive benefits awaiting you.
- Qlik Community
- :
- Forums
- :
- Analytics
- :
- App Development
- :
- Re: How to add the sum of dimensions in a bar grap...
- Subscribe to RSS Feed
- Mark Topic as New
- Mark Topic as Read
- Float this Topic for Current User
- Bookmark
- Subscribe
- Mute
- Printer Friendly Page
- Mark as New
- Bookmark
- Subscribe
- Mute
- Subscribe to RSS Feed
- Permalink
- Report Inappropriate Content
How to add the sum of dimensions in a bar graph
So I have a visualization where I am listing the savings of different categories. For example, I have categories A-E. How do I go about adding the total savings of Categories A-E? Preferably it would be displayed to the right of the other categories divided by a bar if possible.
Thanks in advance!
Accepted Solutions
- Mark as New
- Bookmark
- Subscribe
- Mute
- Subscribe to RSS Feed
- Permalink
- Report Inappropriate Content
Hi Toufique,
Are you trying to achieve this in a bar chart? Sub totals are not available in Sense yet but you have work around and can be done using the script.
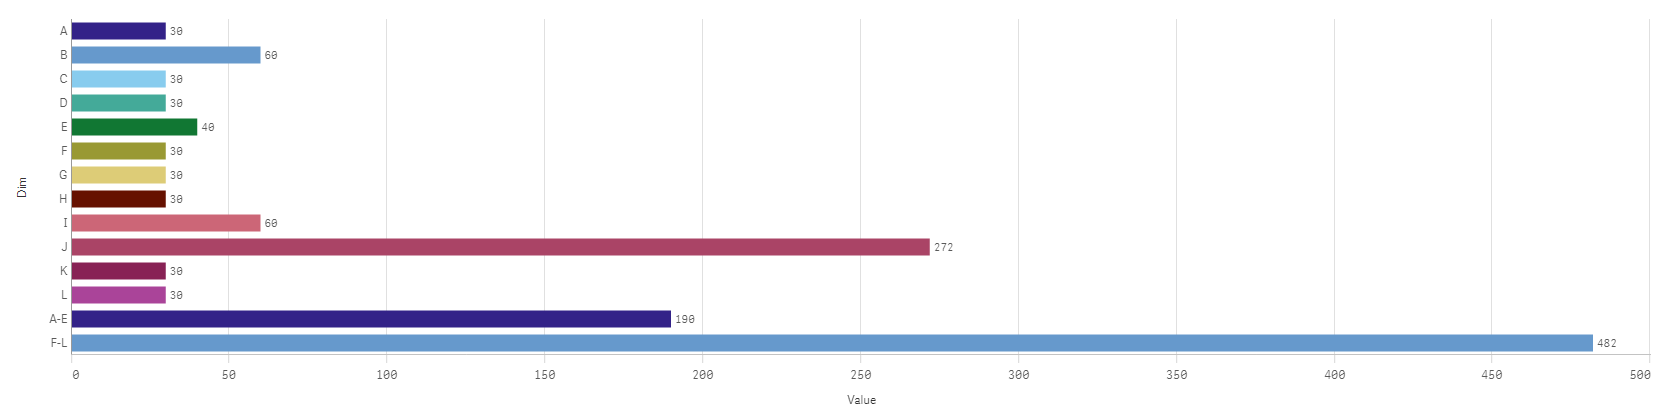
In the image below, the aggregated values A-E and F-L are displayed to the bottom of the chart as you needed.
So follow this:
data:
load * inline [
Dim,Value
A,30
B,60
C,30
D,30
E,40
F,30
G,30
H,30
I,60
J,272
K,30
L,30
];
Mapp:
Mapping load * inline [
Dim,Cat
A,A-E
B,A-E
C,A-E
D,A-E
E,A-E
F,F-L
G,F-L
H,F-L
I,F-L
J,F-L
K,F-L
L,F-L
];
xData:
Load rowno() as Counter,*,
ApplyMap('Mapp', Dim) as Cat
Resident data;
Concatenate
yData:
load rowno() as Counter,Cat as Dim, Sum(Value) as Value
Resident xData group by Cat;
drop table data;
Sort the visualization by Counter
Thanks and Regards,
Sangram Reddy.
- Mark as New
- Bookmark
- Subscribe
- Mute
- Subscribe to RSS Feed
- Permalink
- Report Inappropriate Content
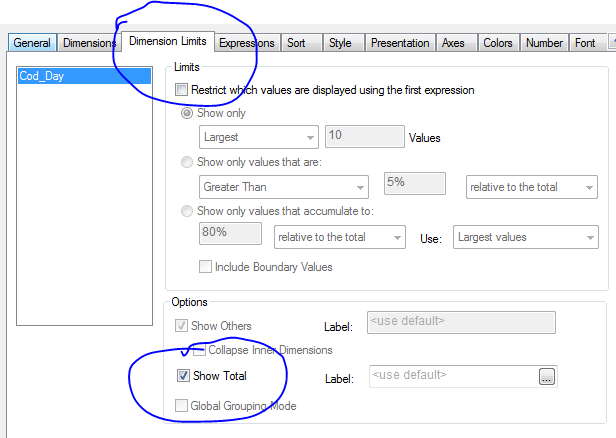
Use 'Show Total' on the Dimension Limits tab:
- Mark as New
- Bookmark
- Subscribe
- Mute
- Subscribe to RSS Feed
- Permalink
- Report Inappropriate Content
Hi Toufique,
As Sunny T mentioned, there is a show totals option in QlikSense table as well.
- Mark as New
- Bookmark
- Subscribe
- Mute
- Subscribe to RSS Feed
- Permalink
- Report Inappropriate Content
This is embarrassing but I do not know how you got to that window?
I am using Qlik Sense Desktop is that makes a difference, but I have not seen a single window in that format.
- Mark as New
- Bookmark
- Subscribe
- Mute
- Subscribe to RSS Feed
- Permalink
- Report Inappropriate Content
No need to be embarrassed. It was my mistake assuming that you are using QlikView. Sangram Reddy should be able to point you out where to go in order to get total.
Best,
Sunny
- Mark as New
- Bookmark
- Subscribe
- Mute
- Subscribe to RSS Feed
- Permalink
- Report Inappropriate Content
Thank you for your time!
- Mark as New
- Bookmark
- Subscribe
- Mute
- Subscribe to RSS Feed
- Permalink
- Report Inappropriate Content
Hello Sangram,
So I am using Qlik Sense Desktop, and thus cannot use the solution Sunny provided. Can you help me complete this action in Qlik Sense Desktop?
- Mark as New
- Bookmark
- Subscribe
- Mute
- Subscribe to RSS Feed
- Permalink
- Report Inappropriate Content
Hi Toufique,
Are you trying to achieve this in a bar chart? Sub totals are not available in Sense yet but you have work around and can be done using the script.
In the image below, the aggregated values A-E and F-L are displayed to the bottom of the chart as you needed.
So follow this:
data:
load * inline [
Dim,Value
A,30
B,60
C,30
D,30
E,40
F,30
G,30
H,30
I,60
J,272
K,30
L,30
];
Mapp:
Mapping load * inline [
Dim,Cat
A,A-E
B,A-E
C,A-E
D,A-E
E,A-E
F,F-L
G,F-L
H,F-L
I,F-L
J,F-L
K,F-L
L,F-L
];
xData:
Load rowno() as Counter,*,
ApplyMap('Mapp', Dim) as Cat
Resident data;
Concatenate
yData:
load rowno() as Counter,Cat as Dim, Sum(Value) as Value
Resident xData group by Cat;
drop table data;
Sort the visualization by Counter
Thanks and Regards,
Sangram Reddy.
- Mark as New
- Bookmark
- Subscribe
- Mute
- Subscribe to RSS Feed
- Permalink
- Report Inappropriate Content
Does this mean I need to manually enter in the value for each category to get the total?
- Mark as New
- Bookmark
- Subscribe
- Mute
- Subscribe to RSS Feed
- Permalink
- Report Inappropriate Content
Not at all, you must be having a table which specify the category s isn't it? So that can be used for mapping purpose.