Unlock a world of possibilities! Login now and discover the exclusive benefits awaiting you.
- Qlik Community
- :
- Forums
- :
- Analytics
- :
- App Development
- :
- Re: How to change the LY Bar color from Red to Gra...
- Subscribe to RSS Feed
- Mark Topic as New
- Mark Topic as Read
- Float this Topic for Current User
- Bookmark
- Subscribe
- Mute
- Printer Friendly Page
- Mark as New
- Bookmark
- Subscribe
- Mute
- Subscribe to RSS Feed
- Permalink
- Report Inappropriate Content
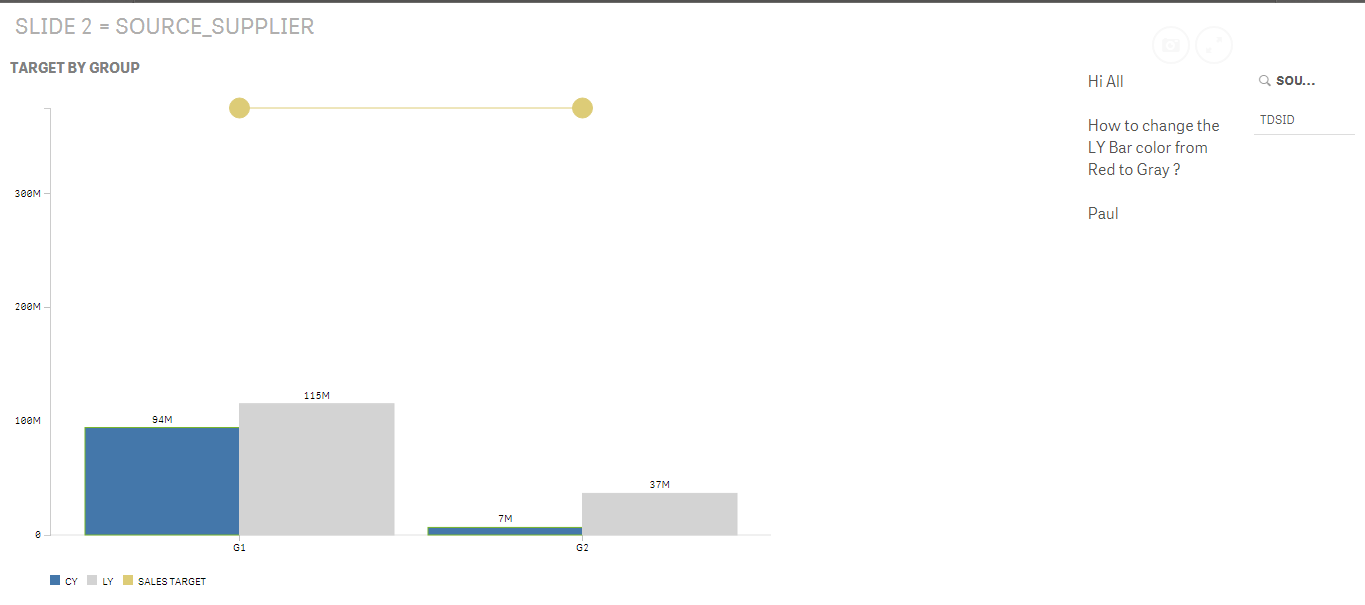
How to change the LY Bar color from Red to Gray ?
Hi All
How to change the LY Bar color from Red to Gray ?
Paul
- « Previous Replies
-
- 1
- 2
- Next Replies »
- Mark as New
- Bookmark
- Subscribe
- Mute
- Subscribe to RSS Feed
- Permalink
- Report Inappropriate Content
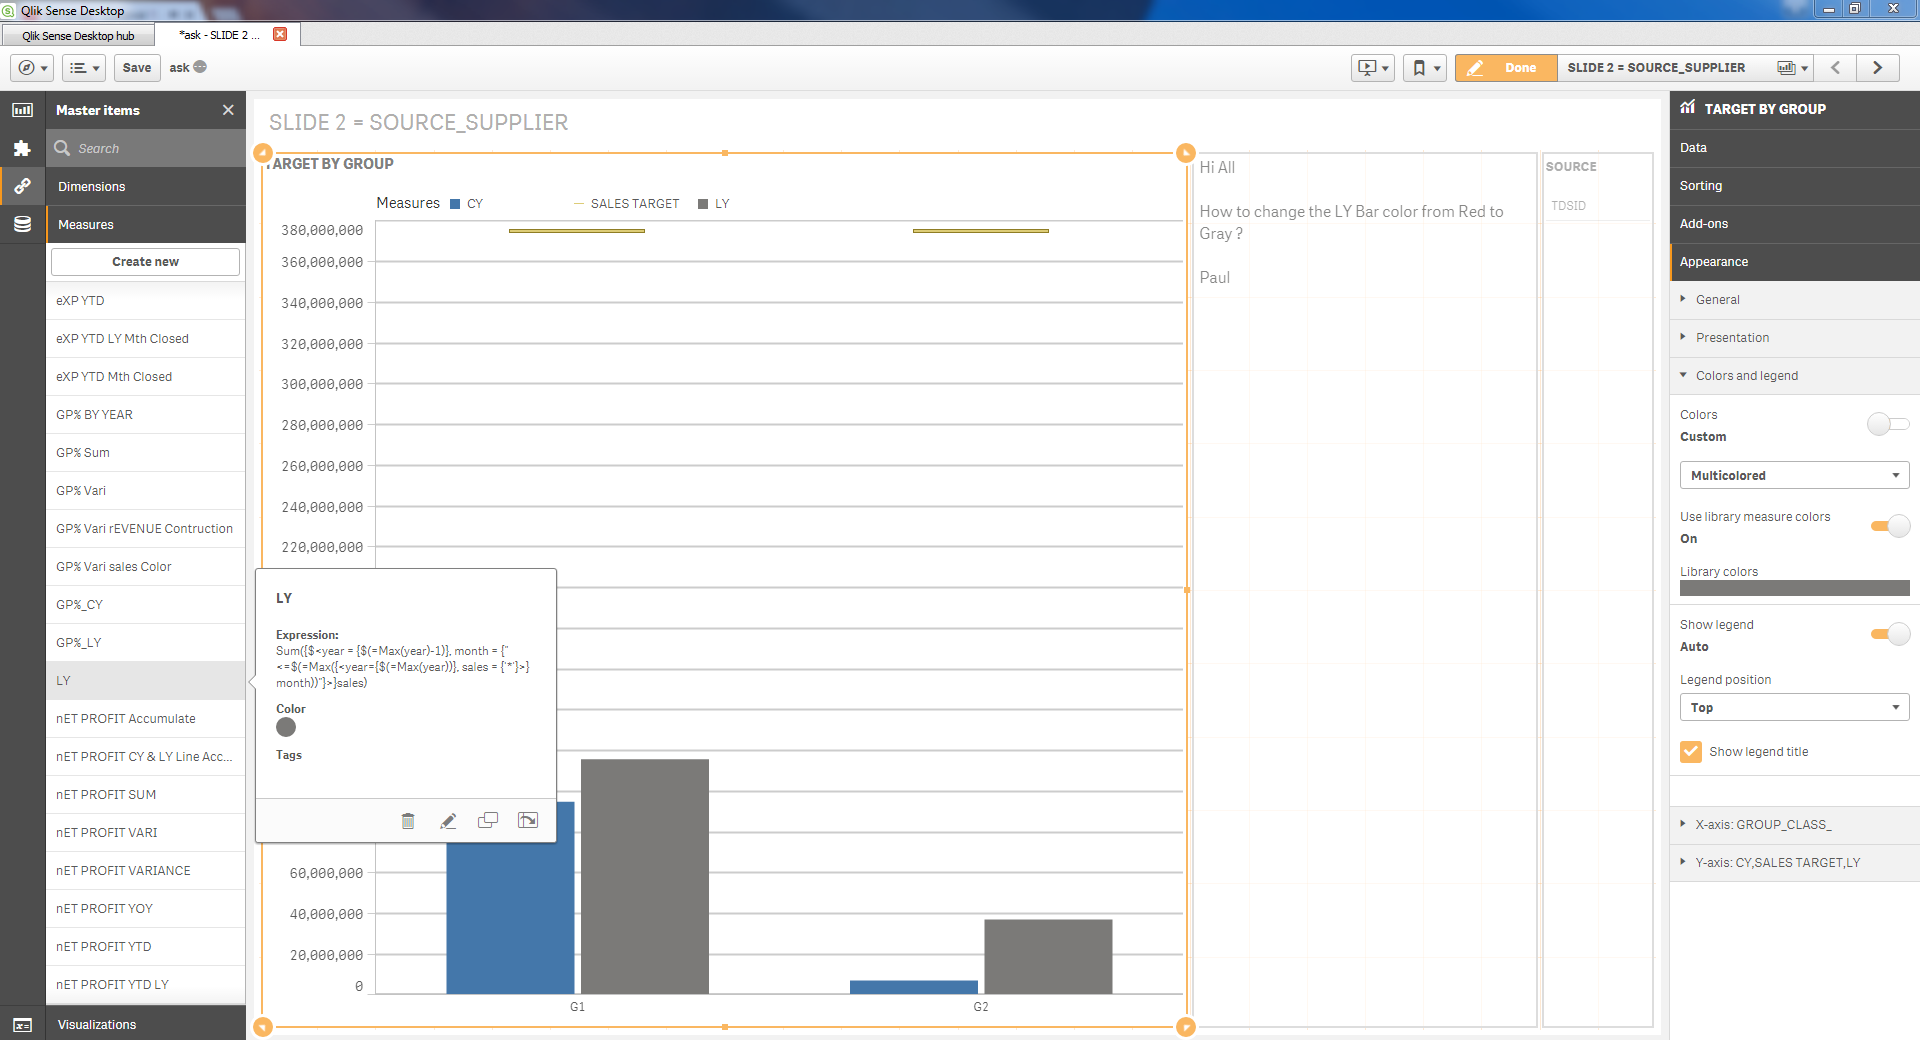
my qvf
- Mark as New
- Bookmark
- Subscribe
- Mute
- Subscribe to RSS Feed
- Permalink
- Report Inappropriate Content
I doubt it is possible with Combo chart..
You can try Extension Qlik Branch.
Else Use valuelist () with Bar Chart
- Mark as New
- Bookmark
- Subscribe
- Mute
- Subscribe to RSS Feed
- Permalink
- Report Inappropriate Content
Hi Shra
Thank you very much for your sharing .
Paul Yeo
DIrector
TDS Technology (S) P/L
Whatsapp +65 9326 1804
www.tdstech.com<http://www.tdstech.com>
- Mark as New
- Bookmark
- Subscribe
- Mute
- Subscribe to RSS Feed
- Permalink
- Report Inappropriate Content
Hi Paul ,
I have tried using Sense UI Combo Chart(Qlik Branch) to change the color of LY to grey. Is this what you wanted?
Regards,
Vikraant
- Mark as New
- Bookmark
- Subscribe
- Mute
- Subscribe to RSS Feed
- Permalink
- Report Inappropriate Content
Hi Paul,
In 3.2 you can add the expression to the library as a measure. Then you can assign a color to the measure that can be used after you turn on "Use library measure colors" in the properties.
Regards,
Patrik.
- Mark as New
- Bookmark
- Subscribe
- Mute
- Subscribe to RSS Feed
- Permalink
- Report Inappropriate Content
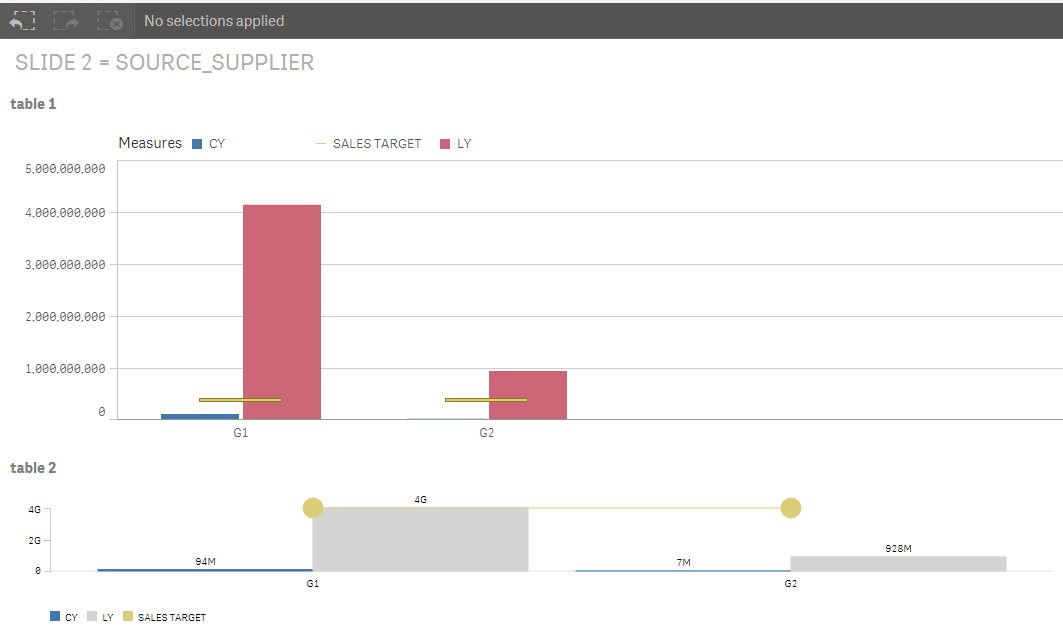
Hi Sir
I have test your QVF file , it can make the Bar color now correct.
But then Table 1 is correct , because the target line is below last year sales.
Table 2 the target is above both LY and CY sales , which is wrong.
How to make Table 2 same as Table 1 ?
Paul
- Mark as New
- Bookmark
- Subscribe
- Mute
- Subscribe to RSS Feed
- Permalink
- Report Inappropriate Content
Hi Paul ,
It seems that there was minor change in the expression for Table 2 .
Expression used in Table 2 was
Sum({$<year = {$(=Max(year)-1)}, month = {"<=$(=Max({<year={$(=Max(year))}, sales = {'*'}>} month))"}>}sales)
Whereas expression used in Table 1 is
Sum({$<year = {$(=Max(year)-1)}, month = {"<=$(=Max({<year={$(=Max(year)-1)}, sales = {'*'}>} month))"}>}sales/1)
After changing the expression the values are matching
Hope this helps!
Sorry for the delayed response!
Regards,
Vikraant
- Mark as New
- Bookmark
- Subscribe
- Mute
- Subscribe to RSS Feed
- Permalink
- Report Inappropriate Content
Hi Sir
Your solution is correct , can you pls share with me why you make that change and it work fine ?
Paul Yeo
DIrector
TDS Technology (S) P/L
Whatsapp +65 9326 1804
www.tdstech.com<http://www.tdstech.com>
- Mark as New
- Bookmark
- Subscribe
- Mute
- Subscribe to RSS Feed
- Permalink
- Report Inappropriate Content
Hi Paul,
I compared both the charts and checked the expression for LY in both the cases. In the second chart, in the expression for LY , In the set expression , max month for current year was found out. Due to this, the values were not matching.
After changing the expression , the values matched.
Regards,
Vikraant
- « Previous Replies
-
- 1
- 2
- Next Replies »