Unlock a world of possibilities! Login now and discover the exclusive benefits awaiting you.
- Qlik Community
- :
- Forums
- :
- Analytics
- :
- App Development
- :
- Re: How to create a Bell Curve in Qlik Sense
- Subscribe to RSS Feed
- Mark Topic as New
- Mark Topic as Read
- Float this Topic for Current User
- Bookmark
- Subscribe
- Mute
- Printer Friendly Page
- Mark as New
- Bookmark
- Subscribe
- Mute
- Subscribe to RSS Feed
- Permalink
- Report Inappropriate Content
How to create a Bell Curve in Qlik Sense
Hi all
I am trying to create a Bell curve in Qlik Sense, I have looked at a number of threads/docs for Qlik View but not having any luck.
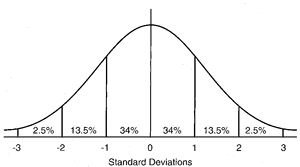
I want to plot a normal distribution bell curve with standard deviation lines for fees charged by Doctors.
Data
| Doctor_Name | Fee_Charged |
|---|---|
| A | 2000 |
| B | 350 |
| C | 450 |
| D | 1123 |
| E | 3456 |
| F | 180 |
| G | 6700 |
| H | 1150 |
| I | 2400 |
| J | 113 |
| .. | .. |
| .. | .. |
Desired Visual
Any help would be appreciated.
Thanks in advance!
- Mark as New
- Bookmark
- Subscribe
- Mute
- Subscribe to RSS Feed
- Permalink
- Report Inappropriate Content
Please refer attached example.
- Mark as New
- Bookmark
- Subscribe
- Mute
- Subscribe to RSS Feed
- Permalink
- Report Inappropriate Content
Hi Sarvesh
Thanks for your reply, looking better but I don't get the bell shape distribution and I cannot get the line to plot.
- Mark as New
- Bookmark
- Subscribe
- Mute
- Subscribe to RSS Feed
- Permalink
- Report Inappropriate Content
Could you share your data with me.
- Mark as New
- Bookmark
- Subscribe
- Mute
- Subscribe to RSS Feed
- Permalink
- Report Inappropriate Content
File attached, I may have missed something obvious here but new to this type of data.
Thanks
- Mark as New
- Bookmark
- Subscribe
- Mute
- Subscribe to RSS Feed
- Permalink
- Report Inappropriate Content
if your problem has been solved then mark this correct and helpful to close this thread.
Regard's
Sarvesh Srivastava
- Mark as New
- Bookmark
- Subscribe
- Mute
- Subscribe to RSS Feed
- Permalink
- Report Inappropriate Content
Not yet, did you receive my attached file?
- Mark as New
- Bookmark
- Subscribe
- Mute
- Subscribe to RSS Feed
- Permalink
- Report Inappropriate Content
Not yet.
- Mark as New
- Bookmark
- Subscribe
- Mute
- Subscribe to RSS Feed
- Permalink
- Report Inappropriate Content
Hi Sarvesh
File is attached
- Mark as New
- Bookmark
- Subscribe
- Mute
- Subscribe to RSS Feed
- Permalink
- Report Inappropriate Content
Hi, here you have a video that shows you how to create Bell curves in Qlik Sense