Unlock a world of possibilities! Login now and discover the exclusive benefits awaiting you.
- Qlik Community
- :
- Forums
- :
- Analytics
- :
- App Development
- :
- Re: How to display the values on bubbles in the sc...
Options
- Subscribe to RSS Feed
- Mark Topic as New
- Mark Topic as Read
- Float this Topic for Current User
- Bookmark
- Subscribe
- Mute
- Printer Friendly Page
Turn on suggestions
Auto-suggest helps you quickly narrow down your search results by suggesting possible matches as you type.
Showing results for
Not applicable
2016-03-22
02:47 PM
- Mark as New
- Bookmark
- Subscribe
- Mute
- Subscribe to RSS Feed
- Permalink
- Report Inappropriate Content
How to display the values on bubbles in the scatter Chart ?
Hi All,
I want to display the values on bubbles in the scatter chart. i am not able to see the values on datapionts option in the experssion.
455 Views
1 Reply
MVP
2016-03-23
01:01 AM
- Mark as New
- Bookmark
- Subscribe
- Mute
- Subscribe to RSS Feed
- Permalink
- Report Inappropriate Content
may be this,
Use the dual function in a calculated dimension: dual(Employee, EmployeeID). 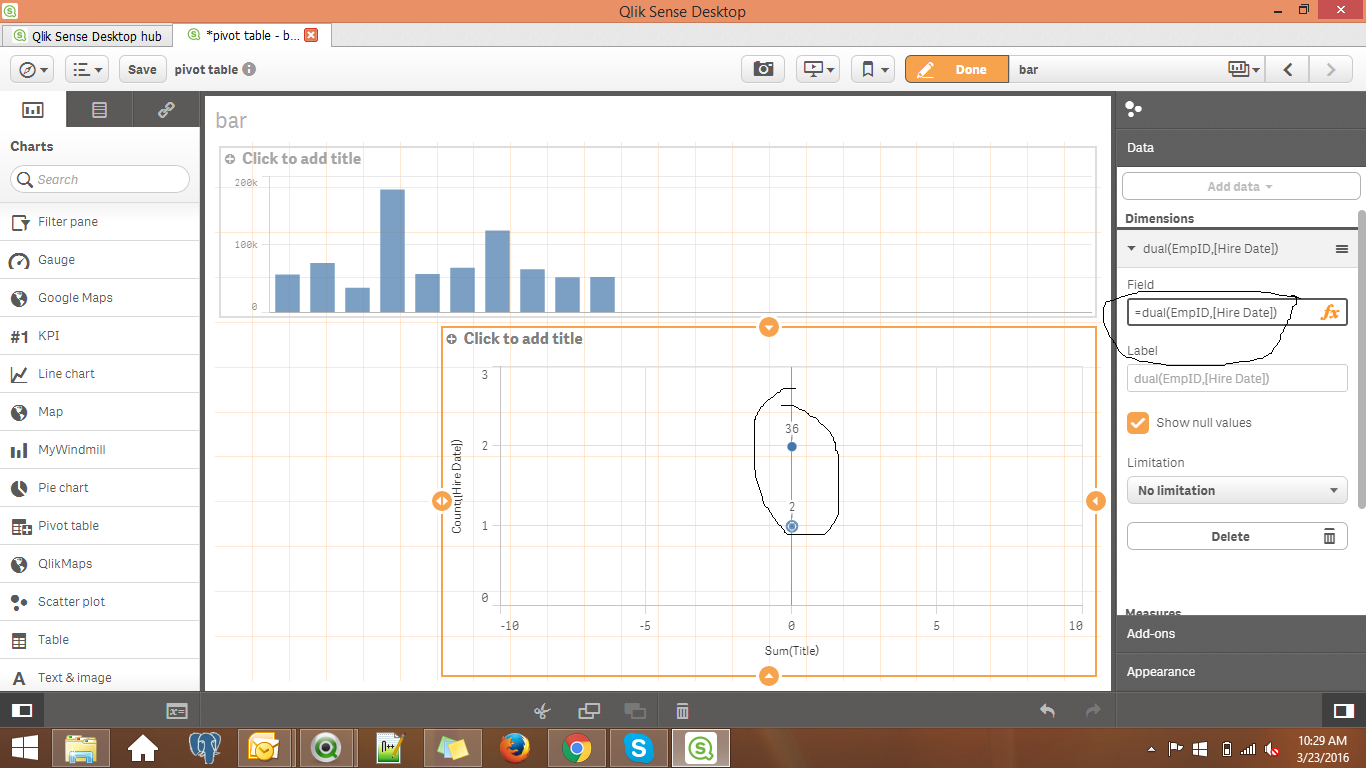 .
.
chk the image
356 Views
Community Browser