Unlock a world of possibilities! Login now and discover the exclusive benefits awaiting you.
- Qlik Community
- :
- Forums
- :
- Analytics
- :
- App Development
- :
- Re: How to display values in charts that are small...
- Subscribe to RSS Feed
- Mark Topic as New
- Mark Topic as Read
- Float this Topic for Current User
- Bookmark
- Subscribe
- Mute
- Printer Friendly Page
- Mark as New
- Bookmark
- Subscribe
- Mute
- Subscribe to RSS Feed
- Permalink
- Report Inappropriate Content
How to display values in charts that are smaller than others?
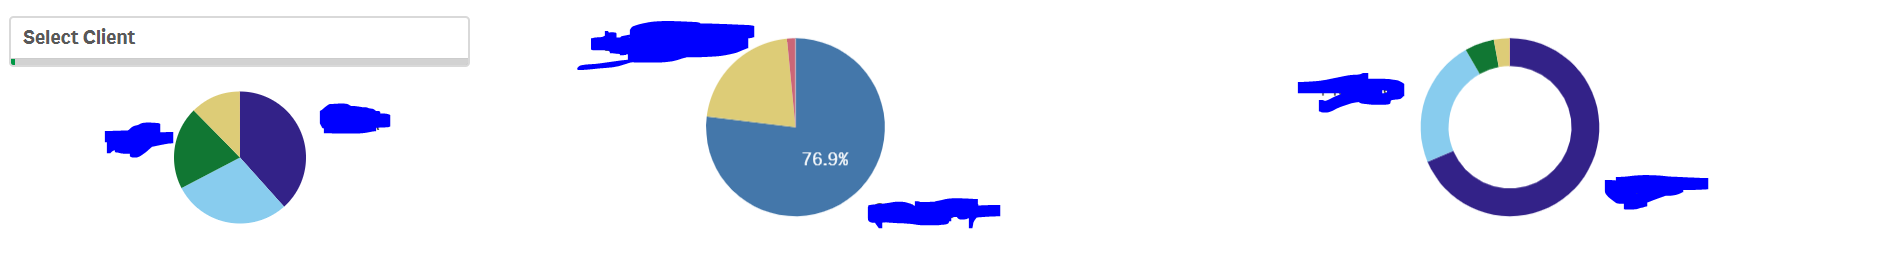
I am trying to make an export friendly board for clients and I have 3 charts that are not displaying values at all likely due to their size. If I blew these charts up, the values would appear however I need the values to appear to the size they have currently. I am sure the solution is simple but I can not figure this out at all. Attached is a photo. This is the top 3rd of my sheet. When exporting, only the 76.9% is displayed, I would like values for each sliver if possible.
Thanks in advance.
- Mark as New
- Bookmark
- Subscribe
- Mute
- Subscribe to RSS Feed
- Permalink
- Report Inappropriate Content
To go into further detail. When I select a client such as this, it shows the values in the first and third pie chart fine because there isn't a high variance.