Unlock a world of possibilities! Login now and discover the exclusive benefits awaiting you.
- Qlik Community
- :
- Forums
- :
- Analytics
- :
- App Development
- :
- Re: How to get all measures in 1 table?
- Subscribe to RSS Feed
- Mark Topic as New
- Mark Topic as Read
- Float this Topic for Current User
- Bookmark
- Subscribe
- Mute
- Printer Friendly Page
- Mark as New
- Bookmark
- Subscribe
- Mute
- Subscribe to RSS Feed
- Permalink
- Report Inappropriate Content
How to get all measures in 1 table?
Hello qlikers!
Here i provide part of my app.
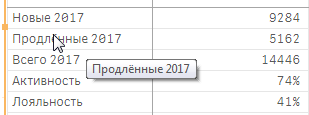
I got months in columns and expr in rows, and the measures, which calculates by exp from my data.
My question is how to collect all this measures into 1 table and how to write correct expr for rows for all these measures - so my point is to write in rows measure description.
Accepted Solutions
- Mark as New
- Bookmark
- Subscribe
- Mute
- Subscribe to RSS Feed
- Permalink
- Report Inappropriate Content
You'll have to use the ValueList function to create synthetic dimensions and one single expression based on valuelist to generate the correct sub-expressions. Perhaps this blog post helps: ValueList() – For those tricky situations
talk is cheap, supply exceeds demand
- Mark as New
- Bookmark
- Subscribe
- Mute
- Subscribe to RSS Feed
- Permalink
- Report Inappropriate Content
Hello, thanks for your answer, it's good solution for me except 1 problem.
I got all my mesures in 1 table as i want. But there are 3 measures of count and 3 other measures of %.
And % shows in shares.
 So i want 74%, 41% 115%
So is there any way to show 2 types of measures in 1 table correctly?
- Mark as New
- Bookmark
- Subscribe
- Mute
- Subscribe to RSS Feed
- Permalink
- Report Inappropriate Content
Hi,
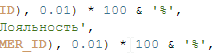
You probably could do the formatting in your expression.
Erik
- Mark as New
- Bookmark
- Subscribe
- Mute
- Subscribe to RSS Feed
- Permalink
- Report Inappropriate Content
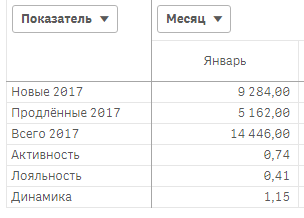
I make this:
and at the end got what i expect