Unlock a world of possibilities! Login now and discover the exclusive benefits awaiting you.
- Qlik Community
- :
- Forums
- :
- Analytics
- :
- App Development
- :
- Re: How to make a multiple table
- Subscribe to RSS Feed
- Mark Topic as New
- Mark Topic as Read
- Float this Topic for Current User
- Bookmark
- Subscribe
- Mute
- Printer Friendly Page
- Mark as New
- Bookmark
- Subscribe
- Mute
- Subscribe to RSS Feed
- Permalink
- Report Inappropriate Content
How to make a multiple table
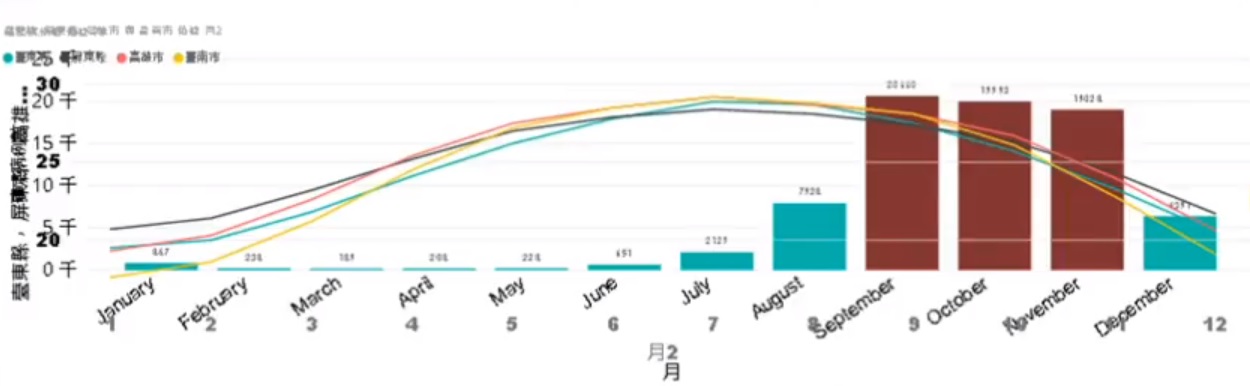
i want to make a chart with two kind of data
In power BI , it is easy to make it (By make 2 chart and overlap it)
But in qlik , i can not overlap 2 chart in one place
How could i do it
Thank you!!
- Mark as New
- Bookmark
- Subscribe
- Mute
- Subscribe to RSS Feed
- Permalink
- Report Inappropriate Content
Hi shi,
Do a combo chart in Sense.
With this data:
load * Inline
[
SalesPerson,Product, Sales
Adam,1, 2000
Adam,2, 1000
Bob,3, 300
Bob,5,100
Mary,1, 10000
Mary,2, 5123
Mary,3, 395
Sally,1, 1300
];
And creating a combo chart, gives me the following
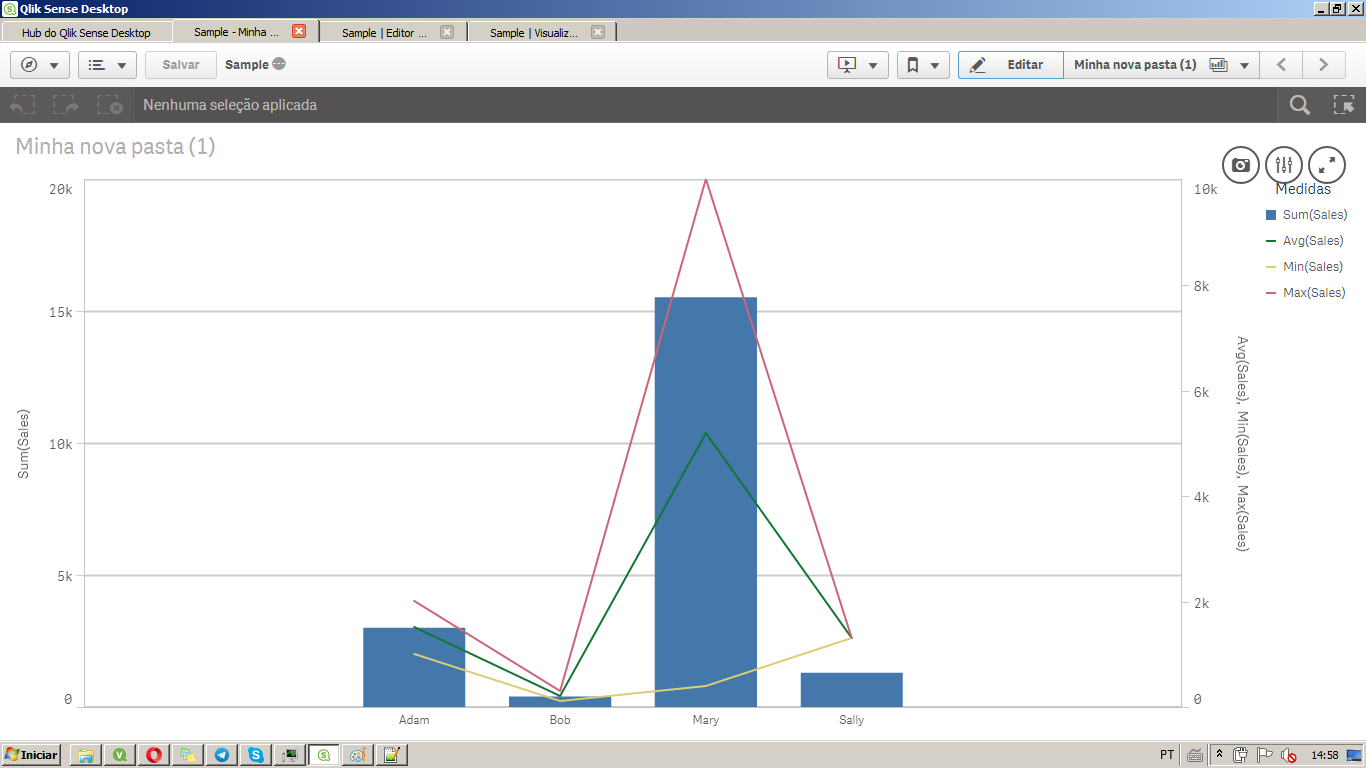
Dummy data, but ilustrates that you can get the same behaviour in one single chart object in Sense.
Attached the sample QVF file I created.
- Mark as New
- Bookmark
- Subscribe
- Mute
- Subscribe to RSS Feed
- Permalink
- Report Inappropriate Content
Hi shih,
Yes, you cannot put two objects at same place in Qlik Sense, but you can do it in QlikView.
However, the Qlik Associative Model allows you to link two or more tables using any field you want, then you can put the both measures at the same graphic.
Create a Master Calendar and connect the two tables to then. Use this example to do that.
How to create master calendar in Qlik Sense
Pedro