Unlock a world of possibilities! Login now and discover the exclusive benefits awaiting you.
- Qlik Community
- :
- Forums
- :
- Analytics
- :
- App Development
- :
- How to put into a graph multiple columns of measur...
- Subscribe to RSS Feed
- Mark Topic as New
- Mark Topic as Read
- Float this Topic for Current User
- Bookmark
- Subscribe
- Mute
- Printer Friendly Page
- Mark as New
- Bookmark
- Subscribe
- Mute
- Subscribe to RSS Feed
- Permalink
- Report Inappropriate Content
How to put into a graph multiple columns of measures (1 column = 1month)?
Hello,
In the case of working on a database presenting multiple columns of quantities (one column for each month), like this one:
| Produits | jan | feb | mar | apr |
|---|---|---|---|---|
| Apples sold | 230 | 220 | 160 | 390 |
| Apples soon to be sold | 410 | 530 | 380 | 640 |
In order to know how many apples are sold through the year, I found out that I could calculate the evolution such as:
january = [jan]
february = [jan]+[feb]
march = [jan]+[feb]+[mar]
april =[jan]+[feb]+[mar]+[apr]
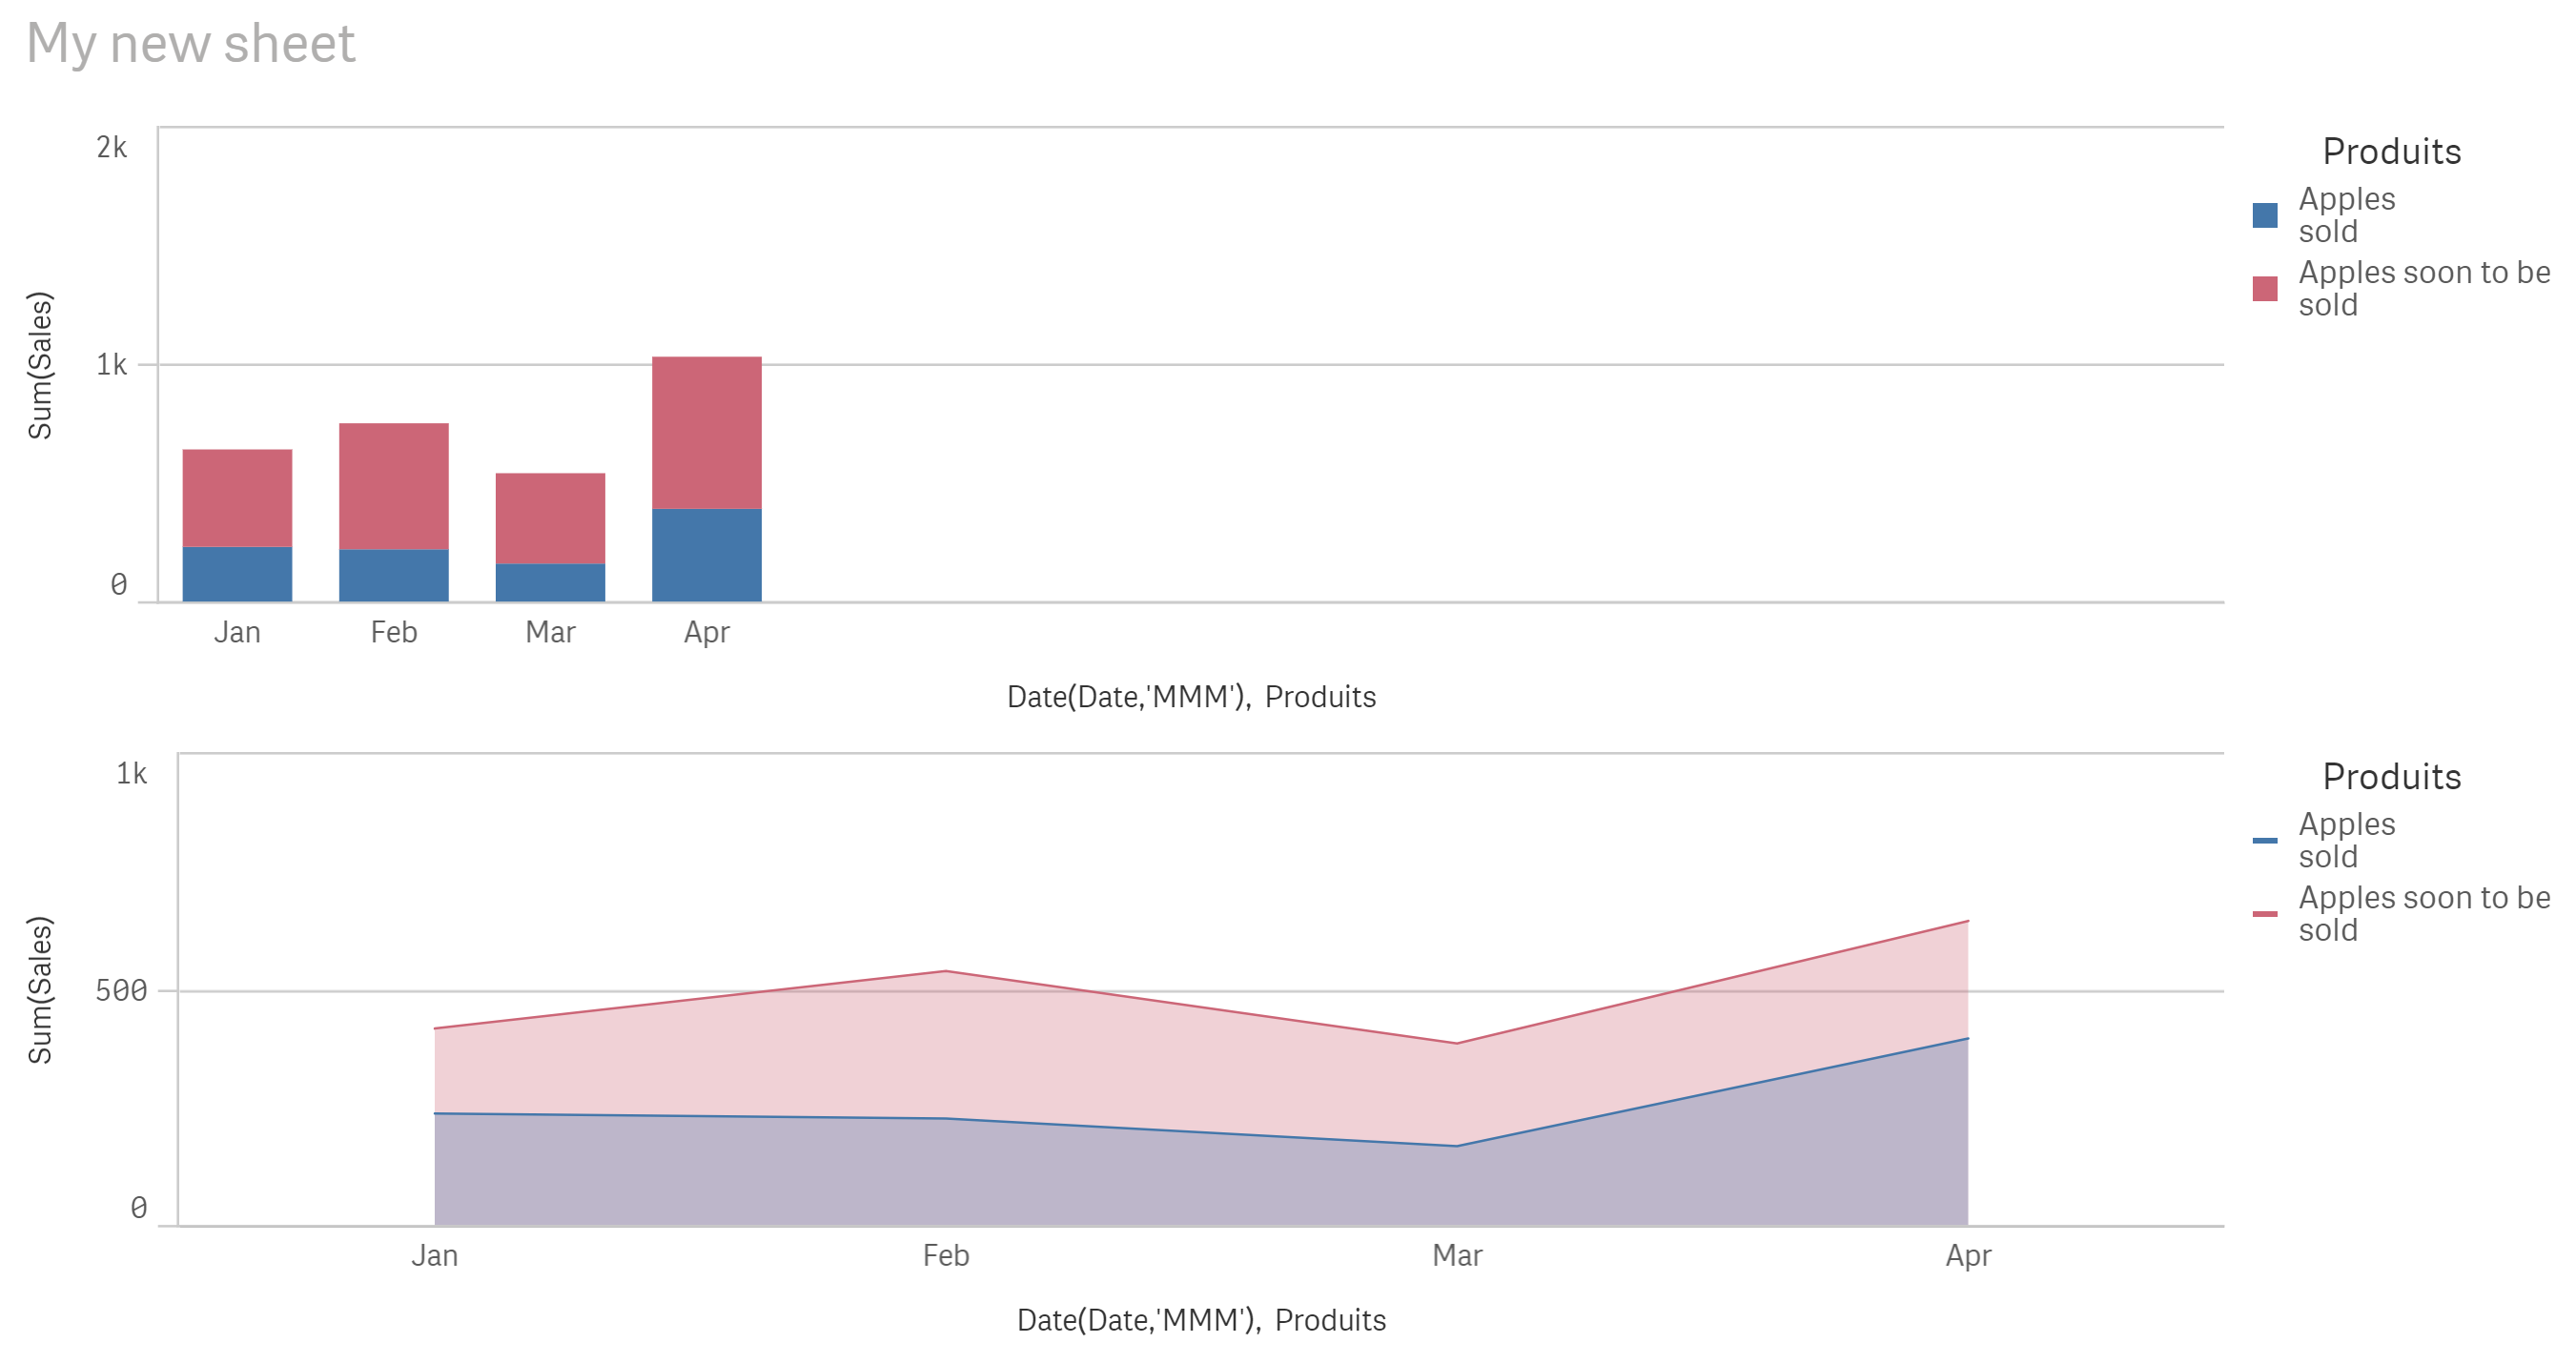
However, when I try to convert these data table into a graph, here is what I get:

As my months are measures and not dimensions, I can't get a graph like this:

or even bettter:

Could you help me find out a way to produce the latests graphs ?
Many thanks for your help.
Olivier
- Mark as New
- Bookmark
- Subscribe
- Mute
- Subscribe to RSS Feed
- Permalink
- Report Inappropriate Content
I believe this is what you are looking for:
It can easily be achieved if you unpivot your data which is a good idea for the raw data you have if you want to create good visualization easily in a BI product like Qlik Sense:
RAWDATA:
CROSSTABLE (Month,Sales)
LOAD * INLINE [
Produits,jan,feb,mar,apr
Apples sold,230,220,160,390
Apples soon to be sold,410,530,380,640
];


DATA:
LOAD
  Produits,
  // Convert the monthnames into real dates to get them sorted correctly
  Date#(Capitalize(Month) & ' 1 2017 ','MMM D YYYY') AS Date,
  Sales
RESIDENT
  RAWDATA;

DROP TABLE RAWDATA;
- Mark as New
- Bookmark
- Subscribe
- Mute
- Subscribe to RSS Feed
- Permalink
- Report Inappropriate Content
Thanks Petter for that first answer, which is very useful. kindly appreciated. 
Now, my data are coming from 2 different documents on server.
Therefore, I need to use the functions LOAD & concatenate LOAD to get my data.
My real data are also looking like this: (but they are evolving. Therefore, I cannot write their values like in your answer)
| apples sold | 1 | 2 | 3 | 4 |
| yes | 230 | 220 | 160 | 390 |
| no | 410 | 530 | 380 | 640 |
From your solution, does that mean I need to write my program as such?
[RAWDATA]:
CROSSTABLE (Month,Costs)
LOAD [apples sold], [1],[2],[3],[4]
FROM [lib://data/doc1.xlsx]
[RAWDATA]:
CROSSTABLE (Month,Costs)
concatenate LOAD [apples sold], [1],[2],[3],[4]
FROM [lib://data/doc2.xlsx]
[DATA]:
LOAD
[apples sold],
// Convert the monthnames into real dates to get them sorted correctly
Date#(Capitalize(Month) & '/2018 ','M/YYYY') AS Date,
Costs
RESIDENT
[RAWDATA];
DROP TABLE [RAWDATA];
My issue is that I got no values... in the graph...
Many thanks for your help again.
Olivier