Unlock a world of possibilities! Login now and discover the exclusive benefits awaiting you.
- Qlik Community
- :
- Forums
- :
- Analytics
- :
- App Development
- :
- How to remove zero values from YoY line chart
- Subscribe to RSS Feed
- Mark Topic as New
- Mark Topic as Read
- Float this Topic for Current User
- Bookmark
- Subscribe
- Mute
- Printer Friendly Page
- Mark as New
- Bookmark
- Subscribe
- Mute
- Subscribe to RSS Feed
- Permalink
- Report Inappropriate Content
How to remove zero values from YoY line chart
Hi,
I have a line chart with YoY comparisons like this. Dimensions is month name. Measures are current fiscal year performance and last fiscal year performance.
Current Year:
if(GetSelectedCount(MonthYear)=1, sum({$<MonthYear=,FiscalYear=,FiscalYear={"$(=Max(FiscalYear))"},Date={"=$(=max(Date))"}>}Orders))
Last Year:
if(GetSelectedCount(MonthYear)=1, sum({$<MonthYear=,FiscalYear=,FiscalYear={"$(=Max(FiscalYear)-2)"}>}Orders))
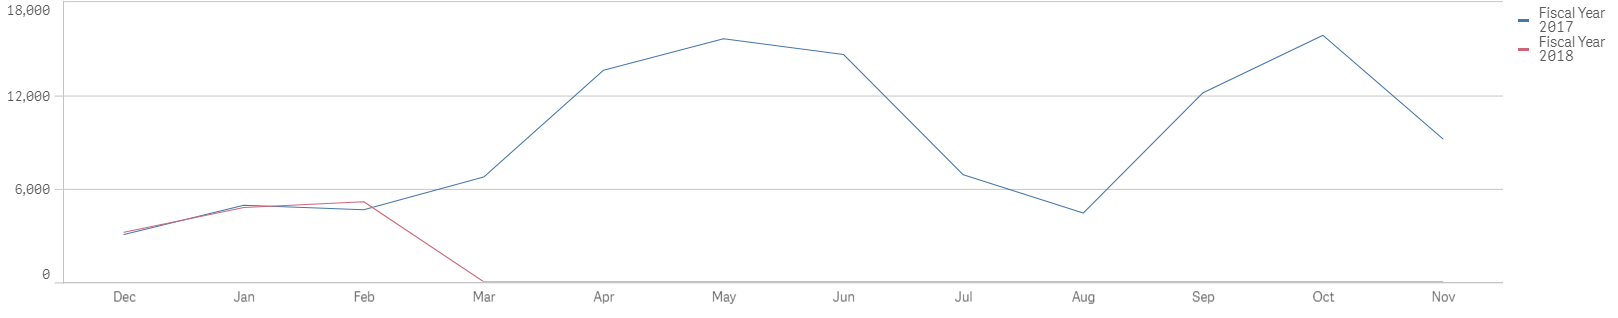
I want to have the red line stops at Feb instead of showing the performance drops to zero since I don't have any data after Feb in 2018. I have tried unchecking "Include zero values" under data handling and unchecking "Include null values" under dimensions. Neither of them worked.
Can anyone help?
Thank you
- Mark as New
- Bookmark
- Subscribe
- Mute
- Subscribe to RSS Feed
- Permalink
- Report Inappropriate Content
Hi,
try this on the current year expression:
if(GetSelectedCount(MonthYear)=1, sum({$<MonthYear=,FiscalYear=,FiscalYear={"$(=Max(FiscalYear))"},Date={"=$(=max(Date))"}, Month={"<=2"}>}Orders))
use the numeric month field
- Mark as New
- Bookmark
- Subscribe
- Mute
- Subscribe to RSS Feed
- Permalink
- Report Inappropriate Content
May be this property is making it 0 -

- Mark as New
- Bookmark
- Subscribe
- Mute
- Subscribe to RSS Feed
- Permalink
- Report Inappropriate Content
This doesn't work
- Mark as New
- Bookmark
- Subscribe
- Mute
- Subscribe to RSS Feed
- Permalink
- Report Inappropriate Content
Just verify that you put the correct Month NUM FIELD and NOT the Month CHAR FIELD on the set analysis.
Can you attach sample app ? or sample data ?