Unlock a world of possibilities! Login now and discover the exclusive benefits awaiting you.
- Qlik Community
- :
- Forums
- :
- Analytics
- :
- App Development
- :
- Re: Is it known behaviour?
- Subscribe to RSS Feed
- Mark Topic as New
- Mark Topic as Read
- Float this Topic for Current User
- Bookmark
- Subscribe
- Mute
- Printer Friendly Page
- Mark as New
- Bookmark
- Subscribe
- Mute
- Subscribe to RSS Feed
- Permalink
- Report Inappropriate Content
Is it known behaviour?
I;am trying to understand my app 
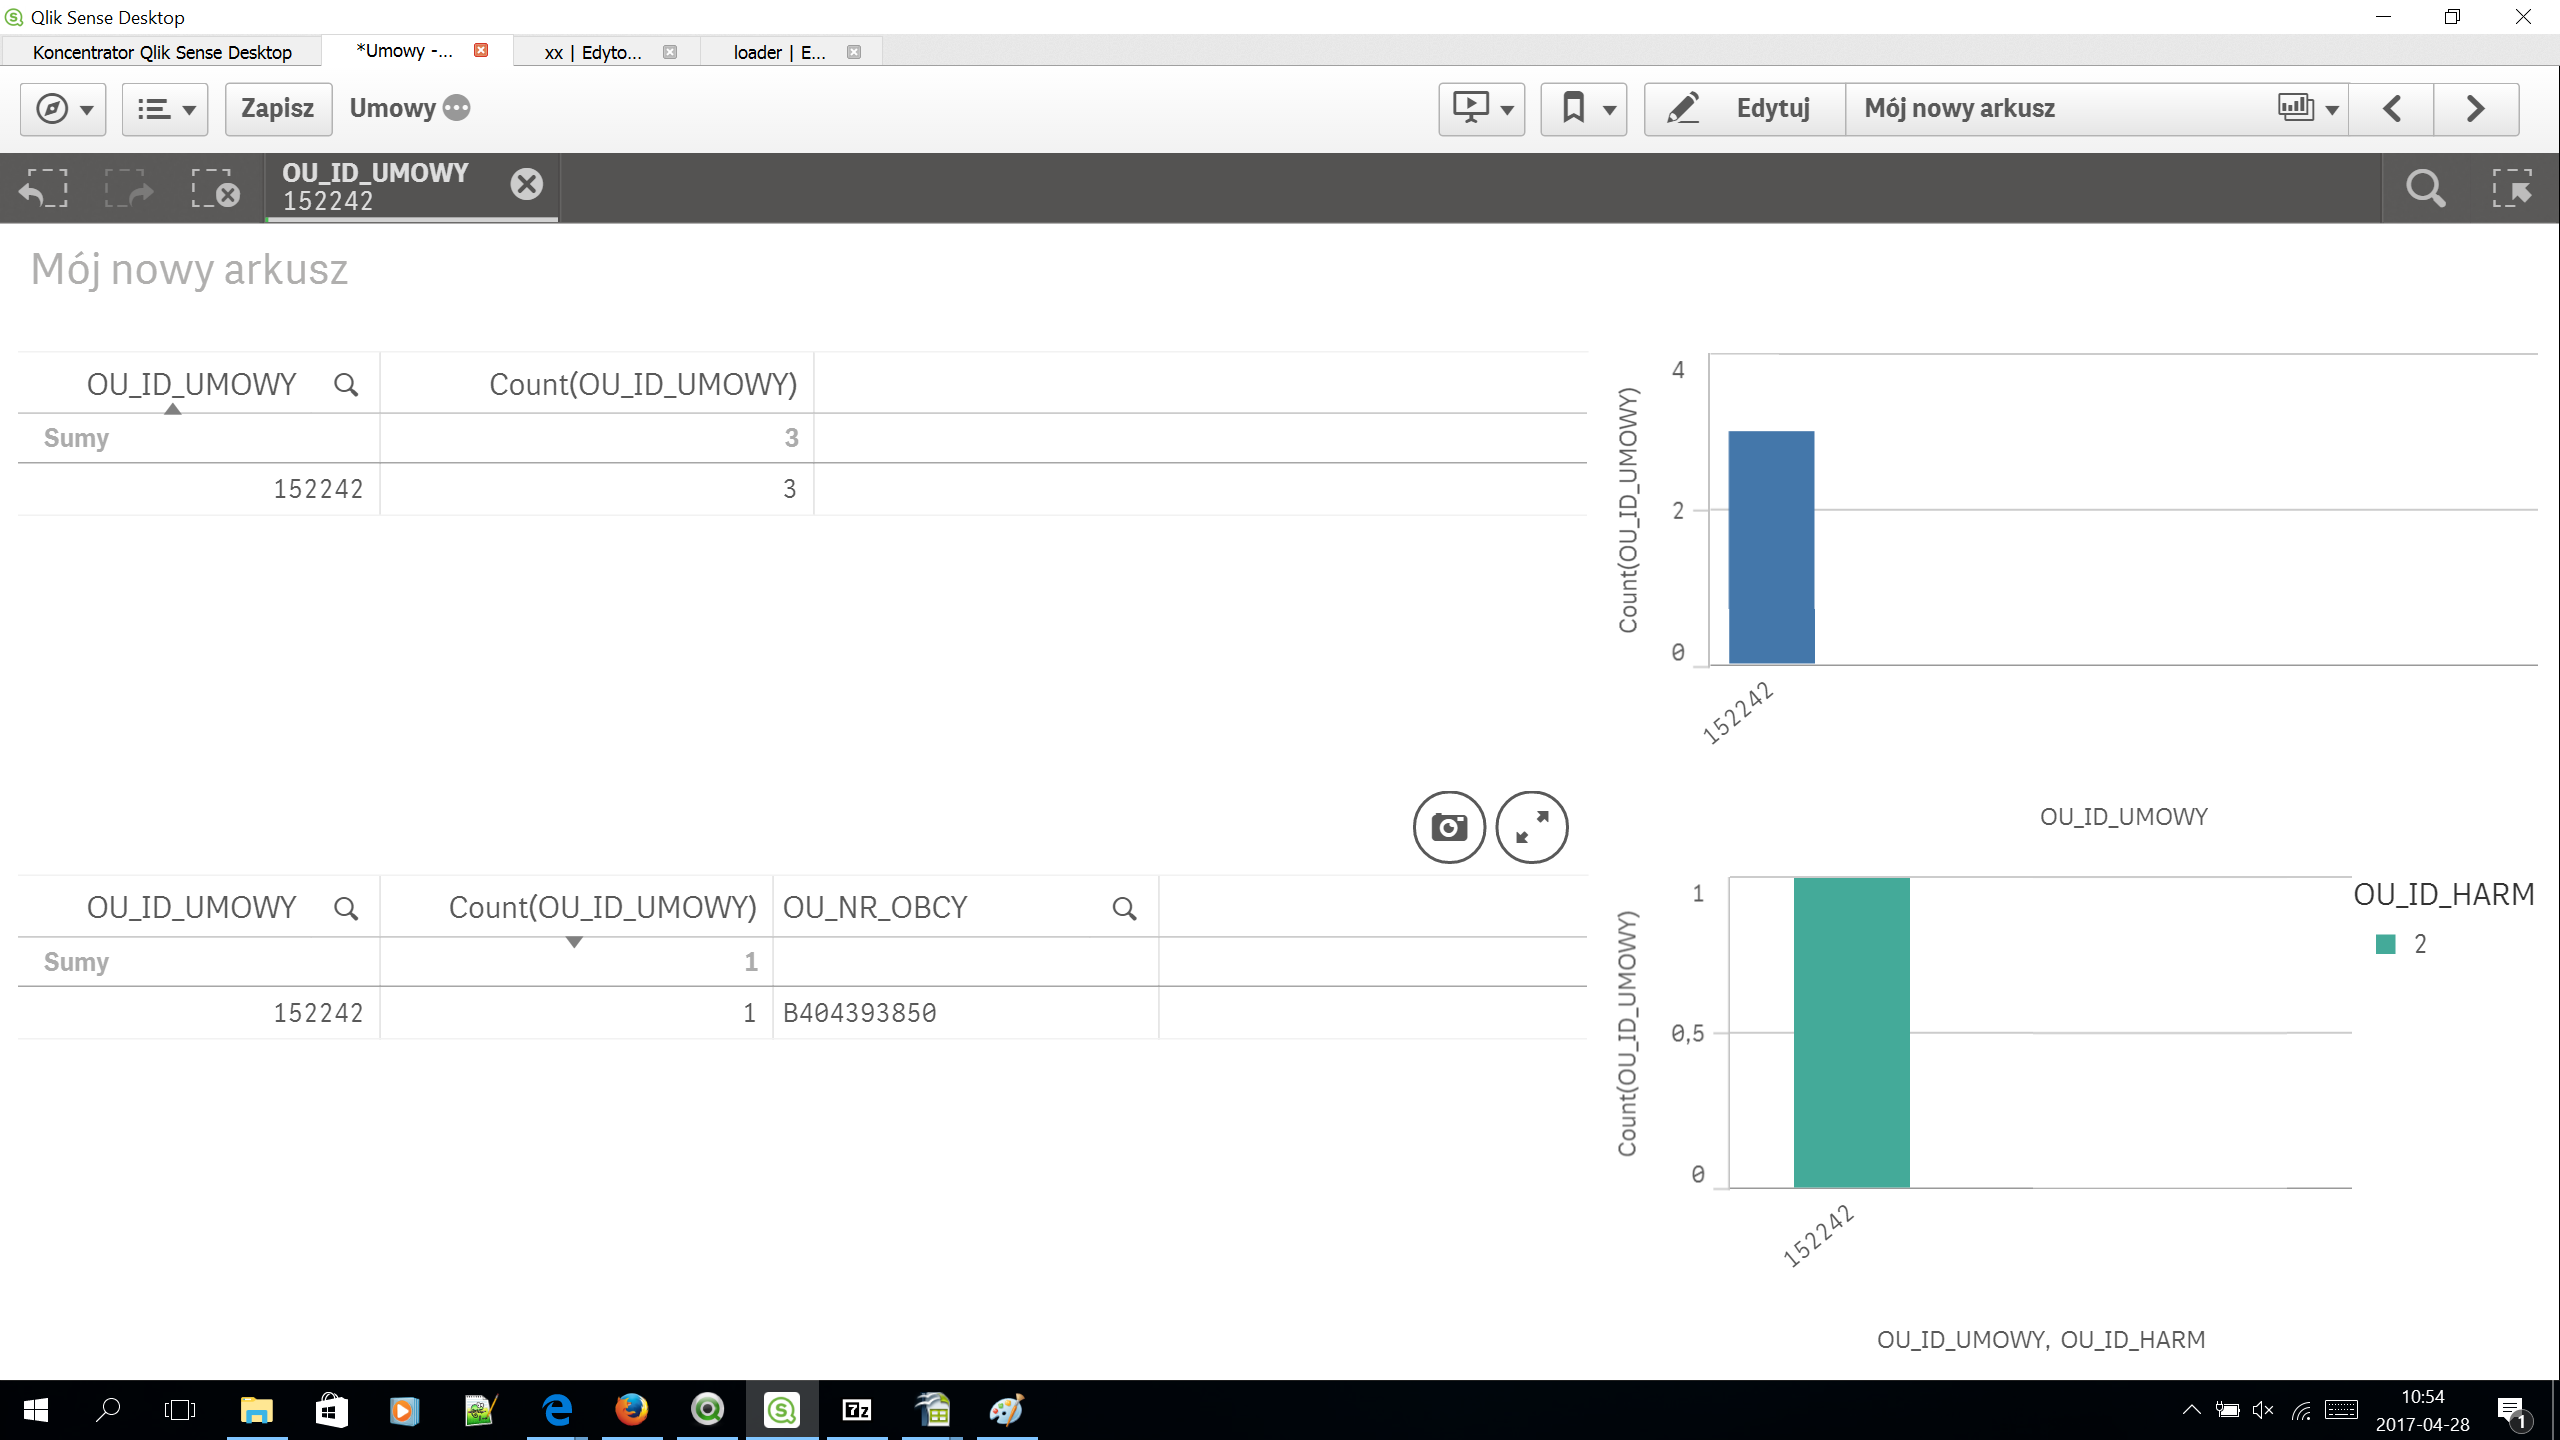
On the picture you have few fields. All fields only in one table of data model.
In source data it looks like it is no duplicate. I also checked data, which i join to this table, and it should no multiply.
When i put into table only ID field and count (ID), my table (or barchart) shows, that i have 3 rows.
If i put to this chart any addisional field (from the same table of data model), the same measure shows 1....
I know of course, that i may use distinc But what if i would like really count rows? I dont like to put "1" to each row of each table
Every suggestion is welcome.
Best regards
Darek
P.S - i'am on desktop with about 100k rows, about 10 tables in data model.
- Tags:
- count records
- « Previous Replies
-
- 1
- 2
- Next Replies »
- Mark as New
- Bookmark
- Subscribe
- Mute
- Subscribe to RSS Feed
- Permalink
- Report Inappropriate Content
I often put a counter field in a table that is set to 1 for every row.
Is there is reason why you do not wish to do this ?
- Mark as New
- Bookmark
- Subscribe
- Mute
- Subscribe to RSS Feed
- Permalink
- Report Inappropriate Content
I'am still not sure if it is my fault or maybe some bug. Thjs is why i am asking if somebody have seen it before.
My data model is rather complex, but the field whose count is counted occurs only in one table. I understand if I used a dimension from another table, but if I throw as a dimension to the chart field, and as a measure count on the same field, and if the field appears only and only in that table, why the result is different from result when I add as next dimension another field from the same table?
Even if there are duplicates in the data, it seems that the result should be the same
(my app purpose is finding duplicates, .... )
And how to tell business user - don't use count(), because results may be wrong?
I still hope that it is only my mistake ....
- Mark as New
- Bookmark
- Subscribe
- Mute
- Subscribe to RSS Feed
- Permalink
- Report Inappropriate Content
Without seeing your full app, load script & data model it is hard to reply definitively, but have a look at this Blog Post To Join or not to Join. It may help you find what has gone adrift in your app.
Taking special note of this bit I have pasted below.
- It minimizes the risk for incorrect calculations. Joins potentially change the number of records in the tables, which means that a normal Sum() or Count() function cannot always be used – they would sometimes return an incorrect result. You may counter that there is always a way to write a correct formula, but my point is that it should also be easy. Expressions in server objects will be written by users that do not have special knowledge about the data model in the app.
Maybe then also have a look at this Blog Post, Don't join - use Applymap instead.
- Mark as New
- Bookmark
- Subscribe
- Mute
- Subscribe to RSS Feed
- Permalink
- Report Inappropriate Content
I understand rules of data modeling
First thing i do when i saw those results was checking, if some joined data do not multiply rows in my table. But it shouldn't.
Still, in any data model, I can not understad why my two charts shows different results if all fields are present in one table, i selected only exactly one ID value and no other selections was made. OK, there may be one case, if additional dimension in one of 3 rows has value and in 2 other rows null, and my charts excludes nulls. I will checki it But if not:
a) If counted field is a key, which have more than one row in any table of my data model, i would expect, that both of charts will show it, (3 should be result even if i take some additional dimension)
b) if counted field is present only in one table, then still adding any other field as next dimension from the same table should not change results:
In any case (except case, when additional dimension has nulls on 2 from 3 rows and nuls excluded by chart) i expect, that both charts will give the same results....
Strange.
Maybe QS makes something wrong in this specific case, when dimension and measure is on the same field and no other field present on chart ....
regards
D
- Mark as New
- Bookmark
- Subscribe
- Mute
- Subscribe to RSS Feed
- Permalink
- Report Inappropriate Content
Maybe you could post a sample qvf with non-confidential data ?
- Mark as New
- Bookmark
- Subscribe
- Mute
- Subscribe to RSS Feed
- Permalink
- Report Inappropriate Content
Not sure if I understand your issue.
Your first table shows the count() expression in a chart with one dimension, the second with a chart with two dimensions?
Could it be that the additional dimension shows NULL in some records and that the chart hide this line?
- Mark as New
- Bookmark
- Subscribe
- Mute
- Subscribe to RSS Feed
- Permalink
- Report Inappropriate Content
I will try to reproduce this behaviour with non production data, and maybe with few less tables, than in oryginal model. Then i will send. I tryed to make the same with few rows and 2 tables, but then results are correct ... Maybe it is something wrong with my app. During developement it was reloaded and changed many Times Anyway, different results in two charts are strange.
Now, after some additional investigation it looks like my ID was a key, and occured few Times in some detail table. So, chart with ID and count (ID) told true. But why, after adding dimension from master table (where row occurs only once) , result changes and dont see, that ID occurs more Times in details? I prepepared app with 2 tables and few rows, and there, after adding dimension from master table results in two charts are the same. Count in both charts shows numer of rows in detail table ..... Strange
- Mark as New
- Bookmark
- Subscribe
- Mute
- Subscribe to RSS Feed
- Permalink
- Report Inappropriate Content
First table shows count of ID (as measure) and the same field (ID) as dimension.
This ID field is a key, which in fact occurs 1 time in master table and 3 Times in 1 detail table.
So, chart, which shows 3 as result telling true.
In 2-nd chart i added as dimension some field from master table. I think, after that looks, like QS count only rows in that table. It is not bad in fact
But there is next question. Why small app i made withh two tables and few rows works different?
I will try to reload big app after commenting everything beyond those 2 tables.
- Mark as New
- Bookmark
- Subscribe
- Mute
- Subscribe to RSS Feed
- Permalink
- Report Inappropriate Content
Lokk new picture I found, that results on measure value (Even a summary) depends on source of used dimension
- « Previous Replies
-
- 1
- 2
- Next Replies »