Unlock a world of possibilities! Login now and discover the exclusive benefits awaiting you.
- Qlik Community
- :
- Forums
- :
- Analytics
- :
- App Development
- :
- Is it possible to control the date format on x-axi...
- Subscribe to RSS Feed
- Mark Topic as New
- Mark Topic as Read
- Float this Topic for Current User
- Bookmark
- Subscribe
- Mute
- Printer Friendly Page
- Mark as New
- Bookmark
- Subscribe
- Mute
- Subscribe to RSS Feed
- Permalink
- Report Inappropriate Content
Is it possible to control the date format on x-axis when continuous is on?
Hi,
I have created a line chart with date dimension and enabled the continuous axis option. Date field which I am using is a calendar month in 'MMM YY' format.
Initially chart is displaying years on x-axis and I am able to zoom on particular year to see the month data.
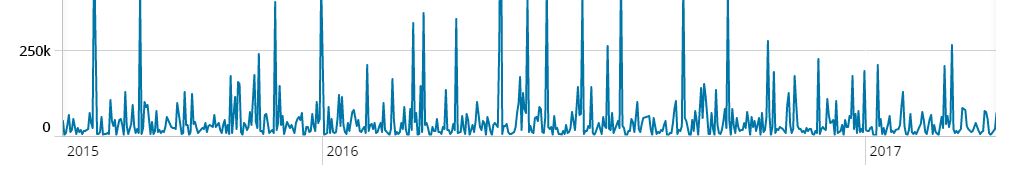
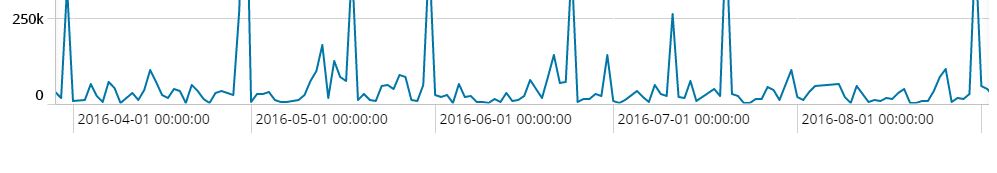
As the date field I am using is a calendar month I would like to restrict the zoom functionality to the month level instead of going to the YYYY-MM-DD hh:mm:ss level.
Is it possible to restrict the Zoom functionality to stop at the month level instead of going to the date level?
or
Is it possible to keep the date format to MMM-YY even though we zoomed to the last level?
Thanks in Advance
- Mark as New
- Bookmark
- Subscribe
- Mute
- Subscribe to RSS Feed
- Permalink
- Report Inappropriate Content
I've done this in the past by crafting my own x-axis legend.
1. Uncheck "Show Legend" on the Dimension tab to suppress the standard legend.
2. Add an Expression with only "Text on Axis" check in the Display Options. An expression like:
=
if(Count(TOTAL Date)>365*20
// Show every 5 years on axis
,if(Date = aggr(min(Date),Year) AND mod(Year,5) = 0
,Year
,''
)
,if(Count(TOTAL Date)>500
// Show Year on axis
,if(Date = aggr(min(Date),Year) AND aggr(NODISTINCT count(Date),Year) > 100
,Year
,''
)
// Show Month on axis
,if(Date = aggr(min(Date),Month,Year)
,Month
,''
)
))
-Rob
- Mark as New
- Bookmark
- Subscribe
- Mute
- Subscribe to RSS Feed
- Permalink
- Report Inappropriate Content
Hi Rob!
This is really neat and actually fits perfectly into what I am trying to do on my own chart. I'm new to QlikSense so I'm still trying to get a grasp on writing expressions, etc.
I was wondering if you could help me edit the expression to display every year instead of every five years. I think I'm going wrong somewhere when I try to change the script.
This is what I have so far:
if(Count(TOTAL BEGIN_DATE)=365
// Show every 5 years on axis
,if(BEGIN_DATE = aggr(min(BEGIN_DATE),BeginDateYear) AND mod(BeginDateYear,1) = 0
,BeginDateYear
,''
)
,if(Count(TOTAL BEGIN_DATE)>500
// Show Year on axis
,if(BEGIN_DATE = aggr(min(BEGIN_DATE),BeginDateYear) AND aggr(NODISTINCT count(BEGIN_DATE),BeginDateYear) > 100
,BeginDateYear
,''
)
// Show Month on axis
,if(BEGIN_DATE = aggr(min(BEGIN_DATE),BeginDateMonth,BeginDateYear)
,BeginDateMonth
,''
)
))
- Mark as New
- Bookmark
- Subscribe
- Mute
- Subscribe to RSS Feed
- Permalink
- Report Inappropriate Content
If you don't want the 5 year variation, you can just eliminate the first if().
if(Count(TOTAL BEGIN_DATE)>500
// Show Year on axis
,if(BEGIN_DATE = aggr(min(BEGIN_DATE),BeginDateYear) AND aggr(NODISTINCT count(BEGIN_DATE),BeginDateYear) > 100
,BeginDateYear
,''
)
// Show Month on axis
,if(BEGIN_DATE = aggr(min(BEGIN_DATE),BeginDateMonth,BeginDateYear)
,BeginDateMonth
,''
)
)
Also, in my example "Date" was in a master calendar so I didn't have to count distinct. If your BEGIN_DATE field is not distinct, i.e. it is in the fact table, your expression should be: Count(TOTAL DISTINCT BEGIN_DATE).