Unlock a world of possibilities! Login now and discover the exclusive benefits awaiting you.
- Qlik Community
- :
- Forums
- :
- Analytics
- :
- App Development
- :
- Is the following line chart with 2 or more colors ...
- Subscribe to RSS Feed
- Mark Topic as New
- Mark Topic as Read
- Float this Topic for Current User
- Bookmark
- Subscribe
- Mute
- Printer Friendly Page
- Mark as New
- Bookmark
- Subscribe
- Mute
- Subscribe to RSS Feed
- Permalink
- Report Inappropriate Content
Is the following line chart with 2 or more colors (dark blue and orange) possible?
Different colors represent different levels of certainty.
The dark blue portion is which realized with no doubt, and orange for what not yet come but expected with good chance.

Accepted Solutions
- Mark as New
- Bookmark
- Subscribe
- Mute
- Subscribe to RSS Feed
- Permalink
- Report Inappropriate Content
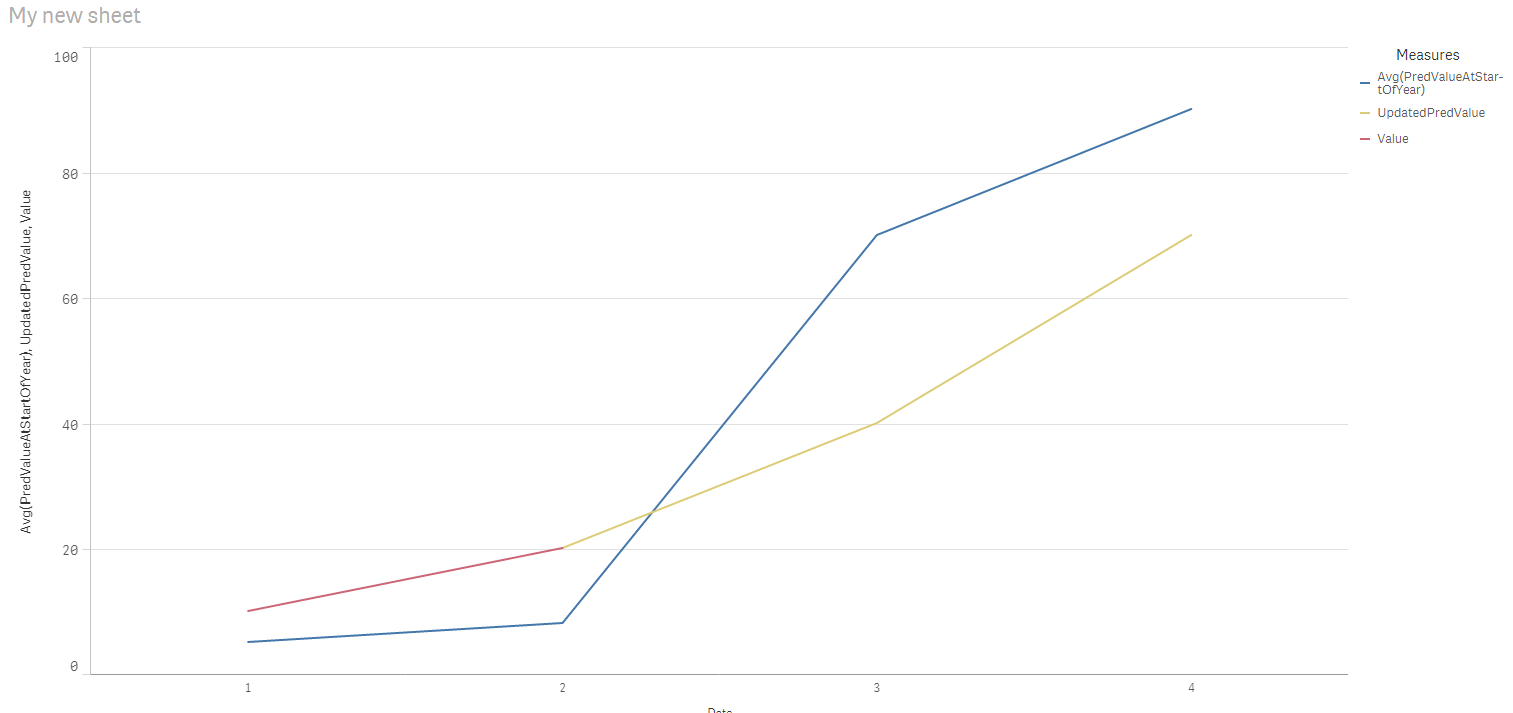
Hi,
If I have understand your right, then yes you can do that in Qlik Sense.
Here I have Date, Value, UpdatedPredValue and PredValueAtStartOfYear.
And if you have a specific color you want to use. You can write an colorexpression for that.
- Mark as New
- Bookmark
- Subscribe
- Mute
- Subscribe to RSS Feed
- Permalink
- Report Inappropriate Content
Hi,
Yes you can color code and display the line chart the way you like.
Check the screen shots for example:
.PNG)
.PNG)
- Mark as New
- Bookmark
- Subscribe
- Mute
- Subscribe to RSS Feed
- Permalink
- Report Inappropriate Content
Thanks! This is exactly what I would like to do.
How can I make it such that Value and UpdatedPredValue will be shown in one line with automatic update?