Unlock a world of possibilities! Login now and discover the exclusive benefits awaiting you.
- Qlik Community
- :
- Forums
- :
- Analytics
- :
- App Development
- :
- Re: Issue with QlikSense Chart Size
- Subscribe to RSS Feed
- Mark Topic as New
- Mark Topic as Read
- Float this Topic for Current User
- Bookmark
- Subscribe
- Mute
- Printer Friendly Page
- Mark as New
- Bookmark
- Subscribe
- Mute
- Subscribe to RSS Feed
- Permalink
- Report Inappropriate Content
Issue with QlikSense Chart Size
Hi,
I have a requirement to put charts ideally in this format i.e.
There are extensions, but since 2 dimensions 1=category,2=YearMonth and 1 Measure=Count(category).... it seems QlikSense by default does not show the data in a compressed format..and forces the user to scroll, and defaulting the scroll to the right isn't sufficient.
Ideally I'd also like an ability to show the chart data as a table(I am aware this can be done with a pivot)
See below for examples.
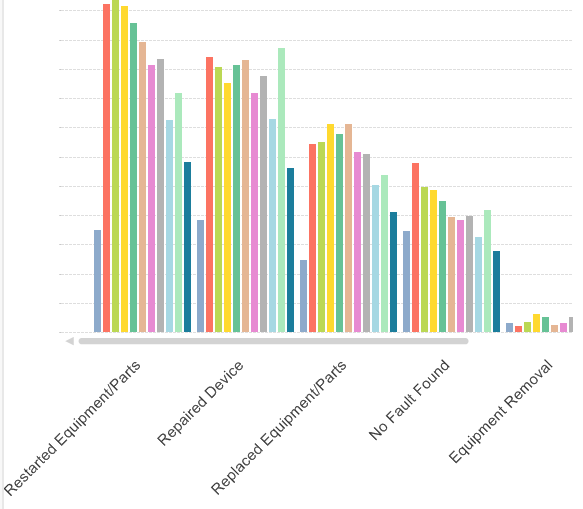
in QlikView this looks ok (legends are excluded from this screenshot) but notice how the bars are close together which is similar to how in Excel the Pivotcharts show the chart all together.
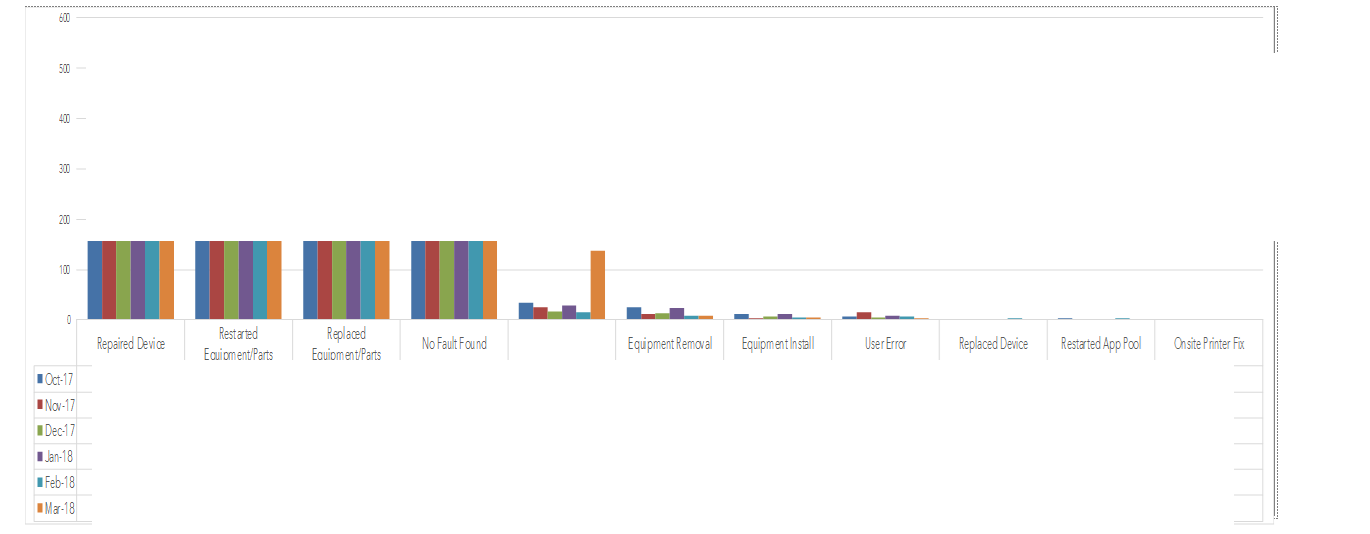
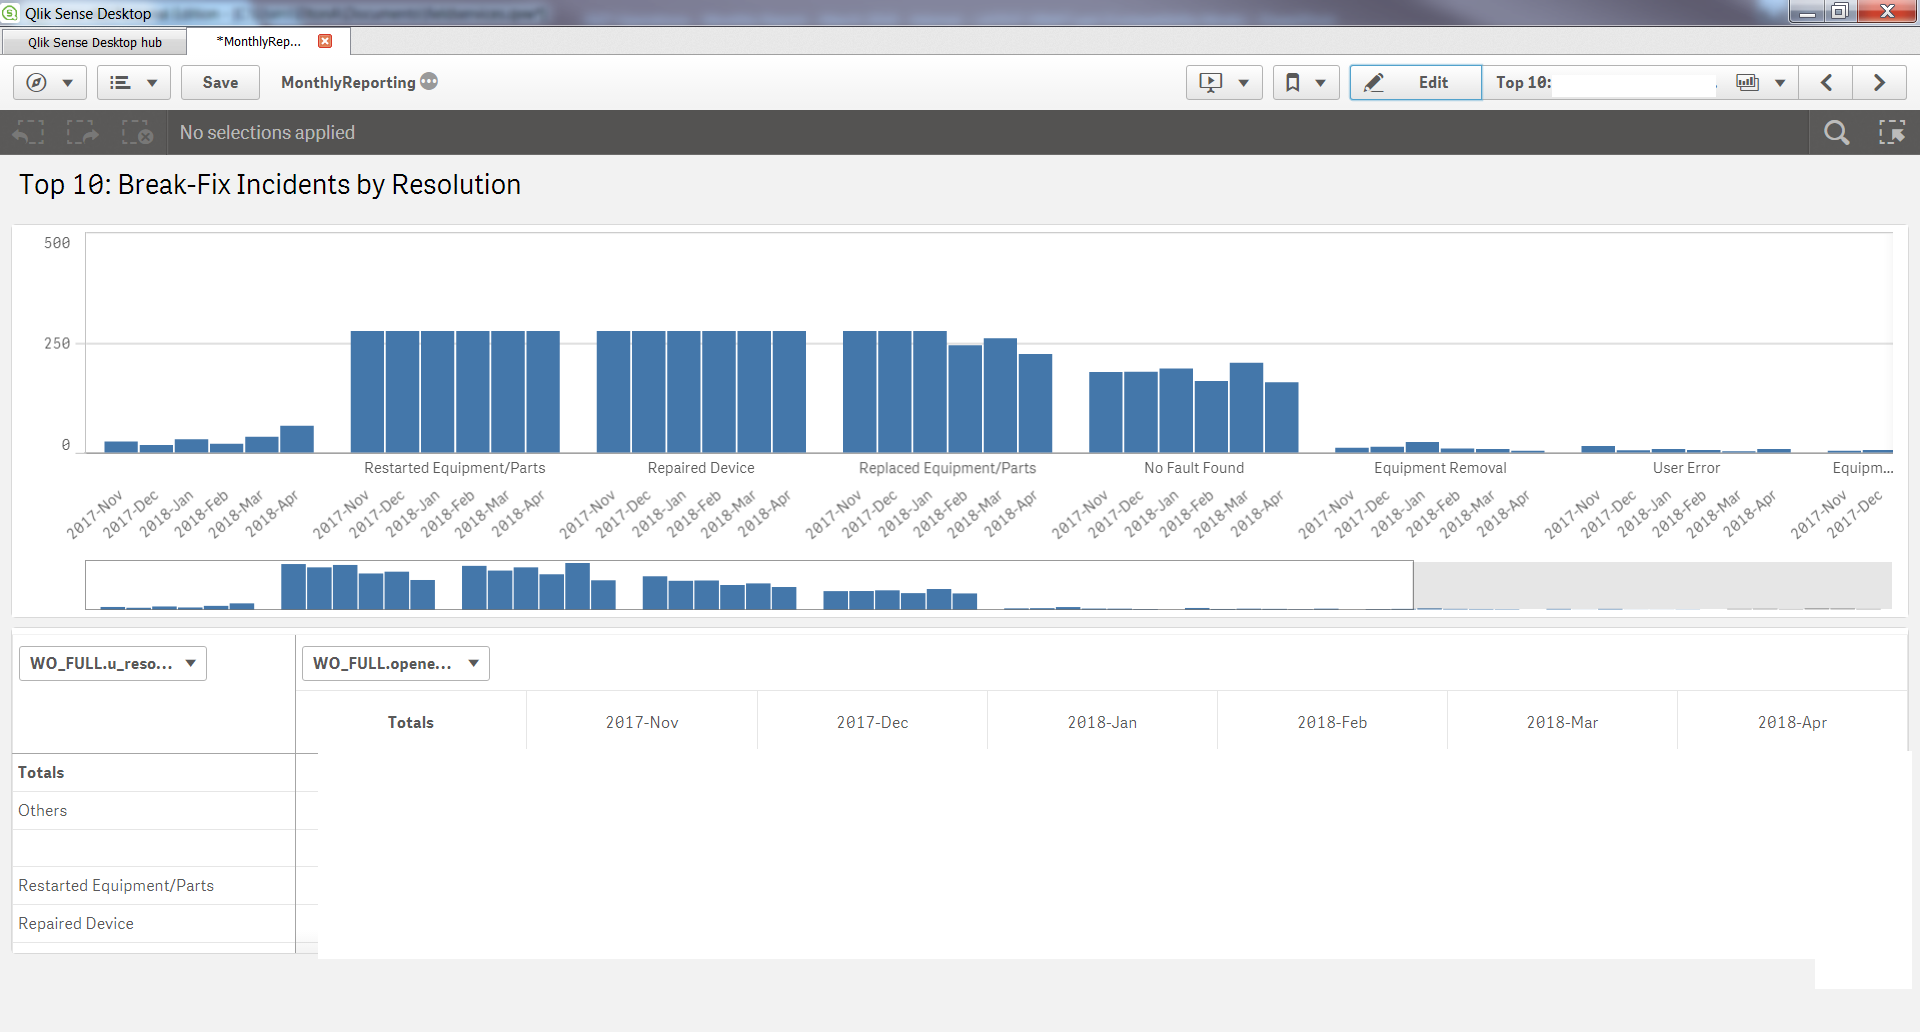
in QlikSense, however you will see the data is forced to scroll, I want it bunched together so it will fit on the screen, and thus work on the storytelling feature.
Message was edited by: Elton Aguiar awaiting approval
- Mark as New
- Bookmark
- Subscribe
- Mute
- Subscribe to RSS Feed
- Permalink
- Report Inappropriate Content
basically need the charts in a compressed format. Tableau and QlikView seem to allow customize of the bar sizes, but not QlikSense, I tried about 10 exte
- Mark as New
- Bookmark
- Subscribe
- Mute
- Subscribe to RSS Feed
- Permalink
- Report Inappropriate Content
Was able to get a variety of solutions... Vizlib appears to be the best solution and managed to compress the chart very well. Only issue now is the PivotTable, I'd like more compressed, JSPivotTable looked great with a very compressed pivot table, with hidden filters, but it has a sorting glitch.
https://github.com/jgerardoc/QlikSense-Ext-JSPivotTable/
I did tried grid sizes in the latest April Version of QlikSense desktop, but it didn't solve the charting issue.
QlikSense Desktop grid changer
http://s3.amazonaws.com/demo-root/random/gridchanger/index.html
VizLib... very good..
- Mark as New
- Bookmark
- Subscribe
- Mute
- Subscribe to RSS Feed
- Permalink
- Report Inappropriate Content
Vizlib Pivot Table should be out soon, in about 4 weeks.