Unlock a world of possibilities! Login now and discover the exclusive benefits awaiting you.
- Qlik Community
- :
- Forums
- :
- Analytics
- :
- App Development
- :
- Re: KPI Value - Count of all FamilyIDs that satisf...
- Subscribe to RSS Feed
- Mark Topic as New
- Mark Topic as Read
- Float this Topic for Current User
- Bookmark
- Subscribe
- Mute
- Printer Friendly Page
- Mark as New
- Bookmark
- Subscribe
- Mute
- Subscribe to RSS Feed
- Permalink
- Report Inappropriate Content
KPI Value - Count of all FamilyIDs that satisfy multiple conditions
Hi,
I've been using QlikSense for a month now. I'm trying to build a KPI which is a division of 2 counts. The numerator is slightly complicated- the count of all distinct family IDs whose total sum of Field1 and Field2 is greater than or equal to 50k, who belong to customer 'A' and have been Assisted. The denominator is the count of all families that belong to customer 'A' and whose total sum of Field1 and Field 2 is greater than or equal to 50k. I've tried a few things but doesn't seem to work. The code I wrote is as follows:
count({<NEW_FAMILYID = {"=sum(Field1)+sum(Field2)>=50000"}, CUSTOMER={'A'}, ASSISTED_CLIENT={'1'} >} distinct NEW_FAMILYID)
/
count({<NEW_FAMILYID = {"=sum(Field1)+sum(Field2)>=50000"}, CUSTOMER={'A'}>} distinct NEW_FAMILYID)
Another thing I tried:
count({<ASSISTED_CLIENT = {'1'},
CUSTOMER = {'A'}>}
distinct If(Aggr(sum(Field1) + Sum(Field2),NEW_FAMILYID)>='50000', NEW_FAMILYID))
/
COUNT({<CUSTOMER = {'A}>} DISTINCT If(Aggr(sum(Field1) + Sum(Field2),NEW_FAMILYID)>='50000', NEW_FAMILYID))
- Mark as New
- Bookmark
- Subscribe
- Mute
- Subscribe to RSS Feed
- Permalink
- Report Inappropriate Content
When you say it isn't working, what is the issue? Incorrect result or error? May be try this
Count({<NEW_FAMILYID = {"=Sum({<CUSTOMER={'A'}, ASSISTED_CLIENT={'1'}>}Field1)+Sum({<CUSTOMER={'A'}, ASSISTED_CLIENT={'1'}>}Field2)>=50000"}, CUSTOMER={'A'}, ASSISTED_CLIENT={'1'}>} DISTINCT NEW_FAMILYID)
/
Count({<NEW_FAMILYID = {"Sum({<CUSTOMER={'A'}>}Field1)+Sum({<CUSTOMER={'A'}>}Field2)>=50000"}, CUSTOMER={'A'}>} distinct NEW_FAMILYID)
- Mark as New
- Bookmark
- Subscribe
- Mute
- Subscribe to RSS Feed
- Permalink
- Report Inappropriate Content
Hi Sunny,
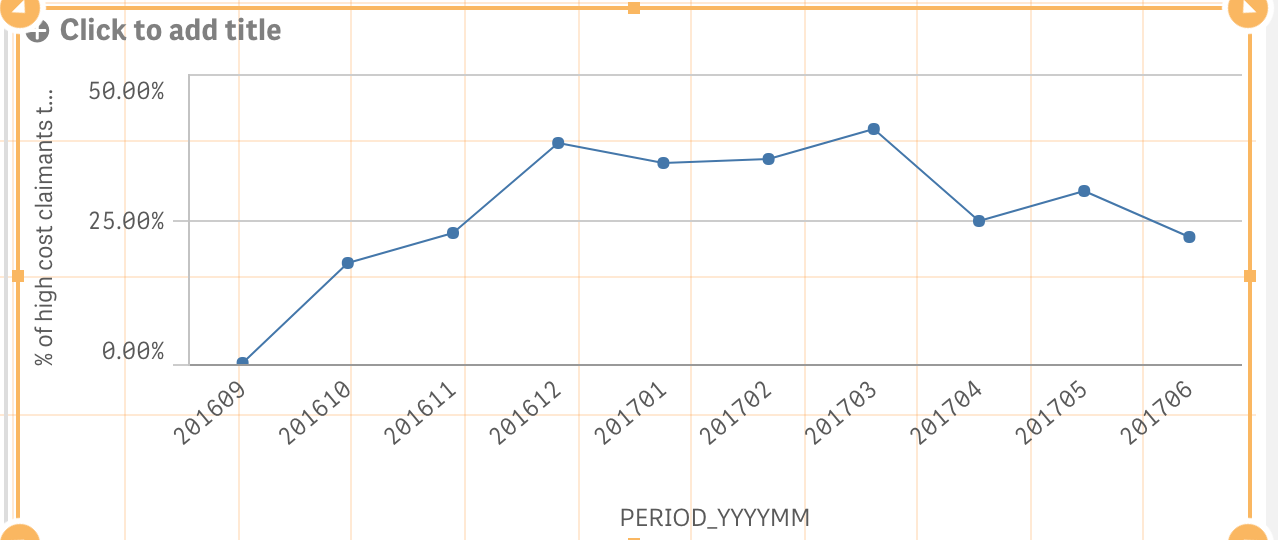
Previously, I used my formula to come up with a line chart where I tracked the KPI value across months. When I used the original formula that I posted about, I was getting all the data points on the chart. However, the data point values were wrong.
Say for January 2017, the actual value is 43.75%. On the chart, I can see something like 34%.
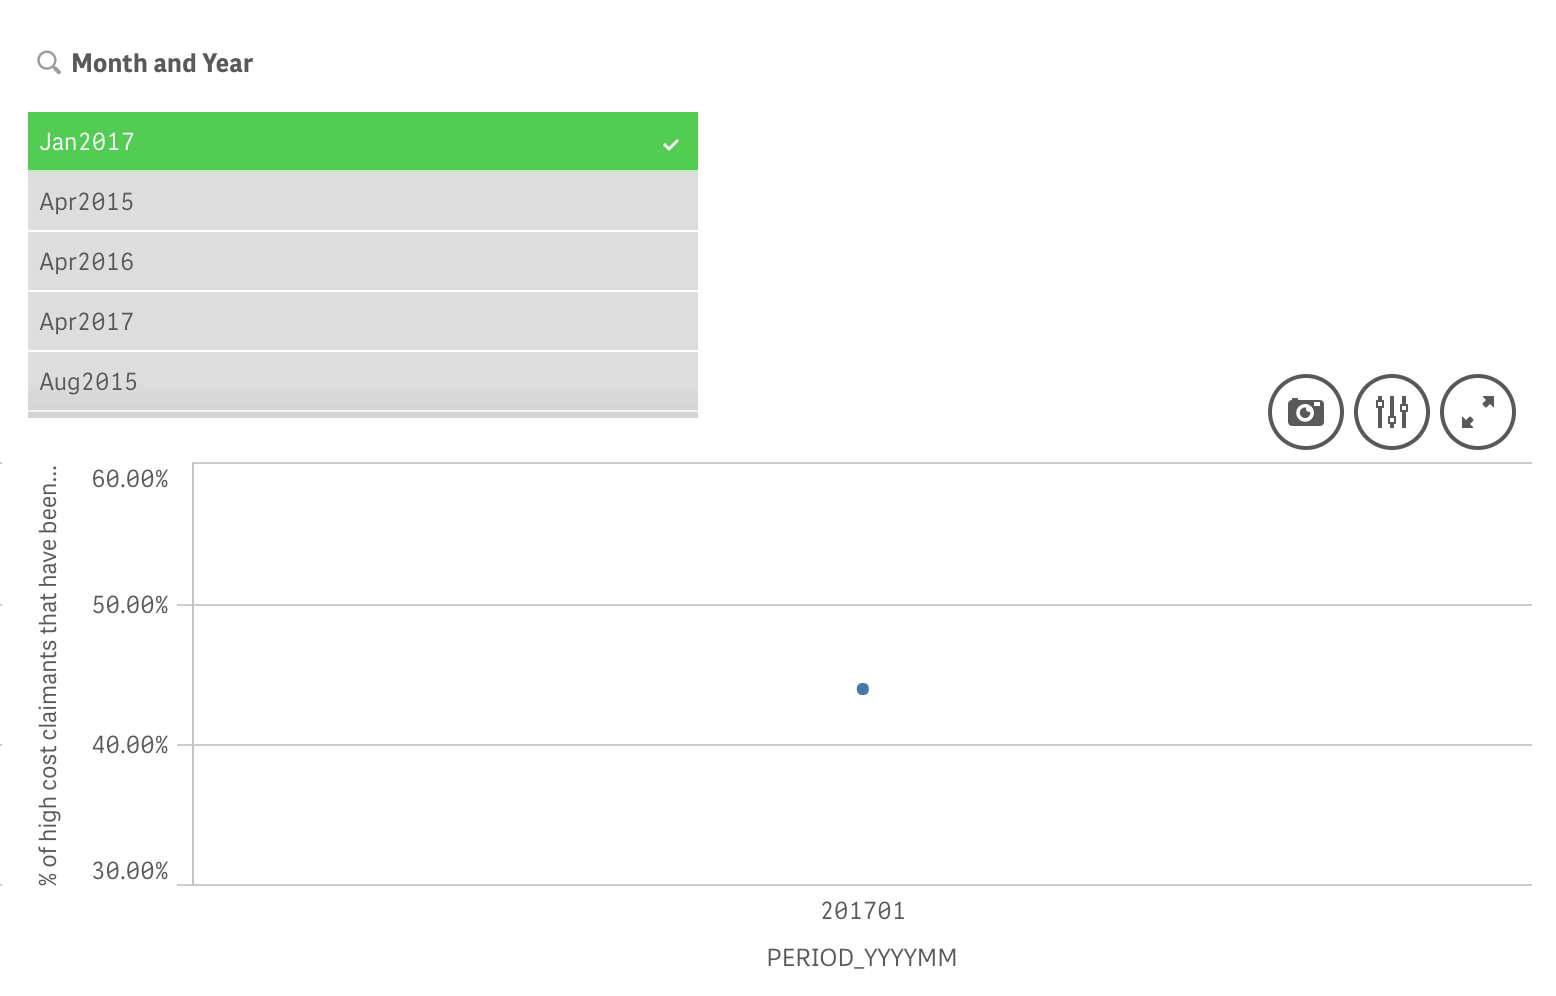
When I drill down using the Month and Year filter and select Jan 2017, the chart value then changes to 43.75%.
But in the chart where it is tracked through out the year, the value displayed is wrong.
When I used your formula, the chart just blanks out. Nothing is displayed across the chart. The screenshot is as follows:
- Mark as New
- Bookmark
- Subscribe
- Mute
- Subscribe to RSS Feed
- Permalink
- Report Inappropriate Content
Would you be able to share your qvf file to look at?
- Mark as New
- Bookmark
- Subscribe
- Mute
- Subscribe to RSS Feed
- Permalink
- Report Inappropriate Content
Unfortunately not. 
- Mark as New
- Bookmark
- Subscribe
- Mute
- Subscribe to RSS Feed
- Permalink
- Report Inappropriate Content
Have you tried creating additional fields in your load script and then using those? If that is possible, it has made a difference with some of my visualizations to put the complicated logic in the load to create additional fields or variables and then use those in my charts.
- Mark as New
- Bookmark
- Subscribe
- Mute
- Subscribe to RSS Feed
- Permalink
- Report Inappropriate Content
Mock up some data?
- Mark as New
- Bookmark
- Subscribe
- Mute
- Subscribe to RSS Feed
- Permalink
- Report Inappropriate Content
Hi ,
Try with following expression :
Count({<NEW_FAMILYID = {"=Sum({<CUSTOMER={'A'}, ASSISTED_CLIENT={'1'}>}Field1)+Sum({<CUSTOMER={'A'}, ASSISTED_CLIENT={'1'}>}Field2)>=50000"}, CUSTOMER={'A'}, ASSISTED_CLIENT={'1'}>} DISTINCT NEW_FAMILYID)
/
Count({<NEW_FAMILYID = {"Sum({<CUSTOMER={'A'}>}Field1)+Sum({<CUSTOMER={'A'}>}Field2)>=50000"}, CUSTOMER={'A'}>} distinct NEW_FAMILYID)
- Mark as New
- Bookmark
- Subscribe
- Mute
- Subscribe to RSS Feed
- Permalink
- Report Inappropriate Content
This is giving the same output as Sunny's. The entire chart just blanks out.