Unlock a world of possibilities! Login now and discover the exclusive benefits awaiting you.
- Qlik Community
- :
- Forums
- :
- Analytics
- :
- App Development
- :
- Re: Limit dimension in aggregated chart
- Subscribe to RSS Feed
- Mark Topic as New
- Mark Topic as Read
- Float this Topic for Current User
- Bookmark
- Subscribe
- Mute
- Printer Friendly Page
- Mark as New
- Bookmark
- Subscribe
- Mute
- Subscribe to RSS Feed
- Permalink
- Report Inappropriate Content
Limit dimension in aggregated chart
Hi.
I have such a strange problem:
I have aggregated chart (rangesum above fo months from the begining of data till now) and it is ok. But I need to see only last 12 months of it.
I cannot limit dimension for top 12 (months) becouse I need calculate all months.
Screens below. I hope anybody can help.
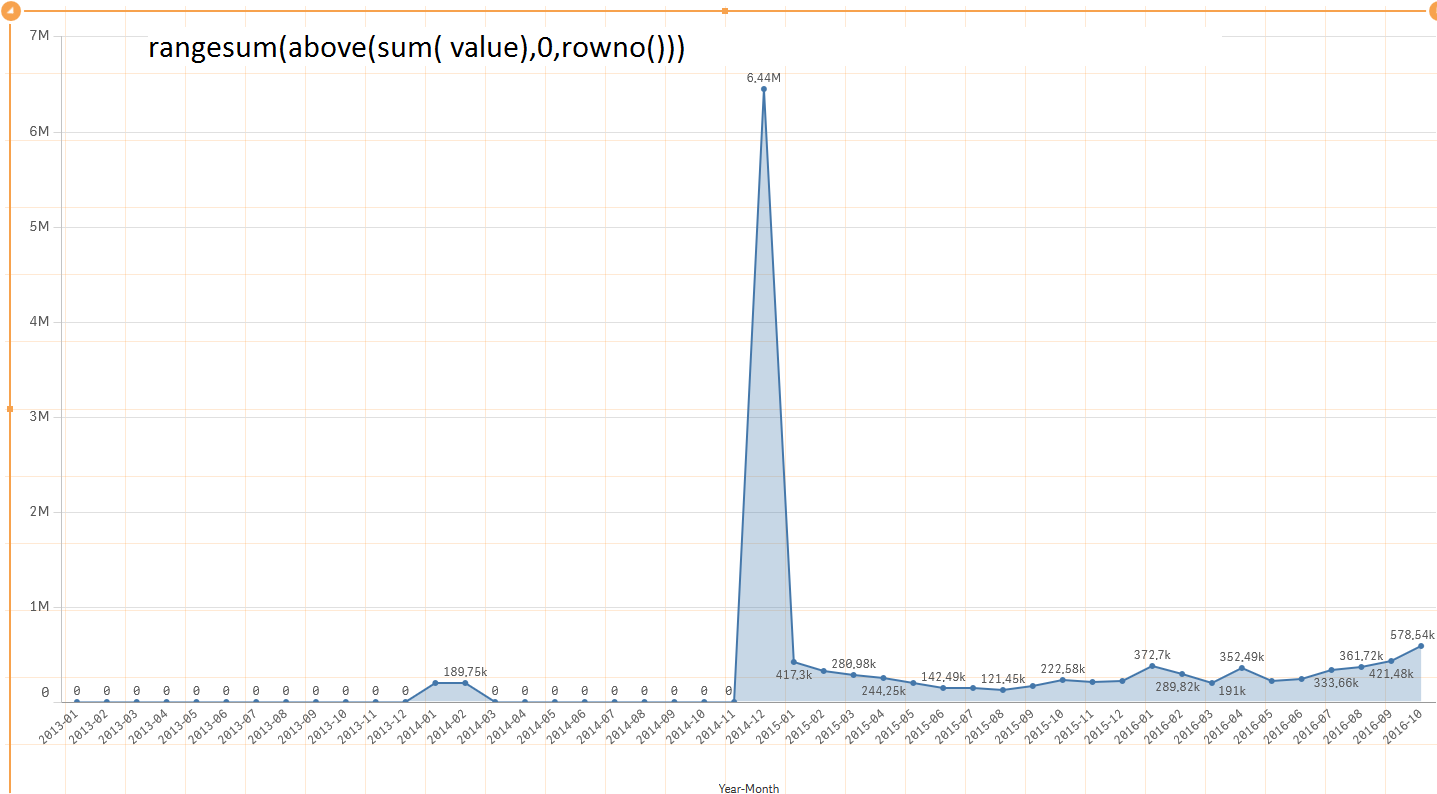
And if I limit this chart with dimension settings or set expression I will only get calculated last 12 months which is wrong.
- « Previous Replies
-
- 1
- 2
- Next Replies »
- Mark as New
- Bookmark
- Subscribe
- Mute
- Subscribe to RSS Feed
- Permalink
- Report Inappropriate Content
But Sangram doing that just removes the axis labels. It still is squished to the right
Why would it not show only those months where we are showing the data?
- Mark as New
- Bookmark
- Subscribe
- Mute
- Subscribe to RSS Feed
- Permalink
- Report Inappropriate Content
Especially that date labels are needed
- Mark as New
- Bookmark
- Subscribe
- Mute
- Subscribe to RSS Feed
- Permalink
- Report Inappropriate Content
Kamil, neither of the sample QVF is working for you?
Have you considered using an AsOf Table then?
Here is another document:
Calculating rolling n-period totals, averages or other aggregations
- Mark as New
- Bookmark
- Subscribe
- Mute
- Subscribe to RSS Feed
- Permalink
- Report Inappropriate Content
Hi Sunny,
In that case you can hide them, if you go to the add-ons panel in the properties of the line chart, you can uncheck the show zero values and they should be gone.
- Mark as New
- Bookmark
- Subscribe
- Mute
- Subscribe to RSS Feed
- Permalink
- Report Inappropriate Content
I already did that, and it is not going away for some reason
- Mark as New
- Bookmark
- Subscribe
- Mute
- Subscribe to RSS Feed
- Permalink
- Report Inappropriate Content
This discussion is to fast for me. Youe second qvf is ok. Thanks. Now I need to understand it! Great thanks to You all
- Mark as New
- Bookmark
- Subscribe
- Mute
- Subscribe to RSS Feed
- Permalink
- Report Inappropriate Content
Hi Sunny,
I believe its because of the table calculations which are being performed (Range sum) . There might be original values but the calculated ones are showing nulls and these are not being interpreted by the visualization.
Can we do the calculation in the data model itself?
Thanks,
Sangram.
- Mark as New
- Bookmark
- Subscribe
- Mute
- Subscribe to RSS Feed
- Permalink
- Report Inappropriate Content
It seems to be working in one version: Re: Limit dimension in aggregated chart, but not in our version?
- Mark as New
- Bookmark
- Subscribe
- Mute
- Subscribe to RSS Feed
- Permalink
- Report Inappropriate Content
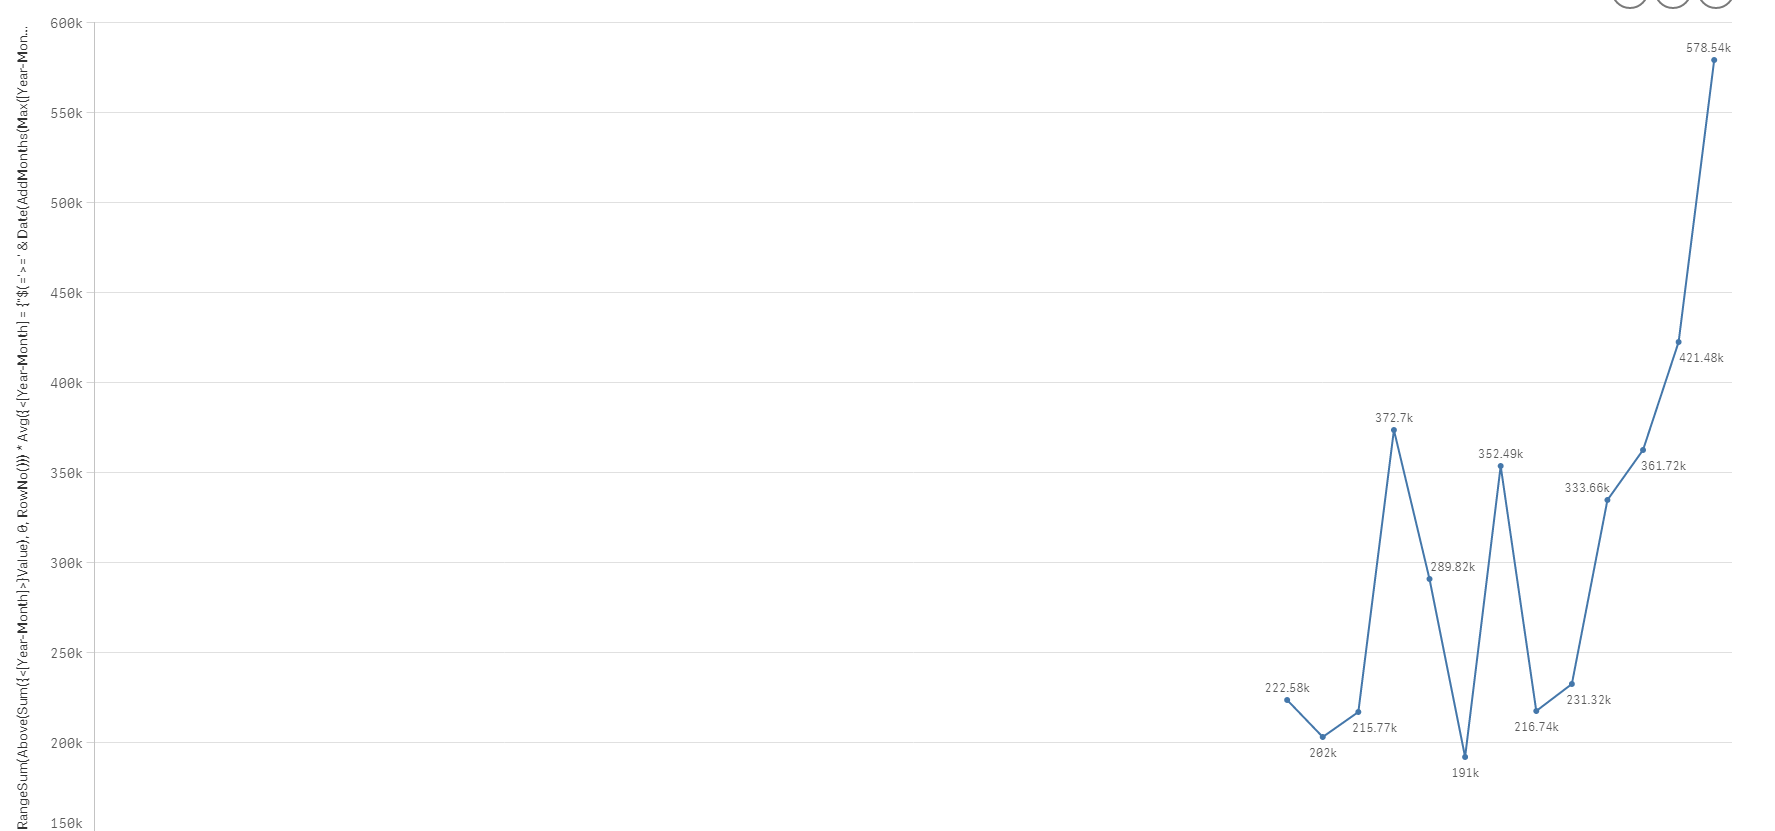
@swuehl. I knew that your solution won't be easy for me. I'm not into set expression, so could you explain me what have you done with this calculation step by step? Especially with set expression. Don't hesitete to write here or (maybe more convenient mail klewandowski@solemis.com)
Only(
{<[Year-Month] = {"$(='>=' & Date(AddMonths(Max([Year-Month]), -12), 'YYYY-MM') & '<=' & Date(AddMonths(Max([Year-Month]), 0), 'YYYY-MM'))"}>}
Aggr( RangeSum(Above(Sum({<[Year-Month]>}Value), 0, RowNo()))
,([Year-Month], (NUMERIC, ASCENDING) )
)
)
- Mark as New
- Bookmark
- Subscribe
- Mute
- Subscribe to RSS Feed
- Permalink
- Report Inappropriate Content
Kamil,
it's well described in
The sortable Aggr function is finally here!
If you have any further questions, just drop me a note
- « Previous Replies
-
- 1
- 2
- Next Replies »