Unlock a world of possibilities! Login now and discover the exclusive benefits awaiting you.
- Qlik Community
- :
- Forums
- :
- Analytics
- :
- App Development
- :
- Line Chart with 2 dimensions and one measure
- Subscribe to RSS Feed
- Mark Topic as New
- Mark Topic as Read
- Float this Topic for Current User
- Bookmark
- Subscribe
- Mute
- Printer Friendly Page
- Mark as New
- Bookmark
- Subscribe
- Mute
- Subscribe to RSS Feed
- Permalink
- Report Inappropriate Content
Line Chart with 2 dimensions and one measure
Hi all experts out there,
hope someone can help me out with my current question:
I try to set up a line chart with 2 dimensions and one measure but I do not get the correct result I need.
My basis date is structured as following:
DATE | ID | DURATION | EVENT | ITEM
01/2015| 100 | 0 | Start | ITEM1
01/2015| 101 | - | Start | ITEM1
01/2015| 102 | - | Start | ITEM1
01/2015| 103 | - | Start | ITEM1
01/2015| 104 | 1 | Start | ITEM1
01/2015| 105 | 2 | Start | ITEM1
01/2015| 106 | 2 | Start | ITEM1
01/2015| 107 | - | Start | ITEM1
01/2015| 108 | - | Start | ITEM1
...
02/2015| 110 | 0 | Start | ITEM1
02/2015| 111 | - | Start | ITEM1
02/2015| 112 | - | Start | ITEM1
02/2015| 113 | - | Start | ITEM1
02/2015| 114 | 1 | Start | ITEM1
02/2015| 114 | 2 | Start | ITEM1
02/2015| 115 | 2 | Start | ITEM1
02/2015| 116 | 2 | Start | ITEM1
02/2015| 117 | - | Start | ITEM1
02/2015| 118 | - | Start | ITEM1
...
My Dimensions are DATE and DURATION.
My Measure should be Count(DURATION)/Count(Distinct(ID) which looks in table form like this:
DATE | DURATION | Count(DURATION) | Count(EVENT) | Count(DURATION)/Count(Distinct(ID))
01/2015 | 0 | 1 | 9 | 11,1%
01/2015 | 1 | 1 | 9 | 11,1%
01/2015 | 2 | 2 | 9 | 22,2%
02/2015 | 0 | 1 | 10 | 10,0%
02/2015 | 1 | 1 | 10 | 10,0%
02/2015 | 2 | 3 | 10 | 30,0%
The final result should then look like:
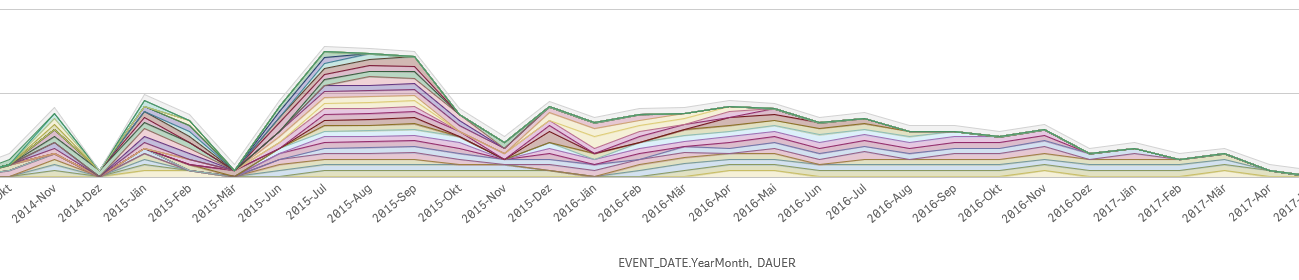
At the moment I've the problem, that for the 2nd dimension I do not get the correct total Count(Distinct(ID)) per month. Either I can choose with Count(Total(Distinct(ID)) all ID's (but not per month) or I get a wrong result, because due to the 2nd dimension my table above is automatically split up. Is there any way to avoid this?
Any help would be appreciated!
- Mark as New
- Bookmark
- Subscribe
- Mute
- Subscribe to RSS Feed
- Permalink
- Report Inappropriate Content
May be try this
Count(DURATION)/Count(TOTAL <DATE> DISTINCT ID)
Or this
Count(DURATION)/Aggr(NODISTINCT Count(DISTINCT ID), DATE)
- Mark as New
- Bookmark
- Subscribe
- Mute
- Subscribe to RSS Feed
- Permalink
- Report Inappropriate Content
Thanks for the answer.
Both ways work at least partly, when I use [DATE.autoCalendar.YearMonth] instead of DATE.
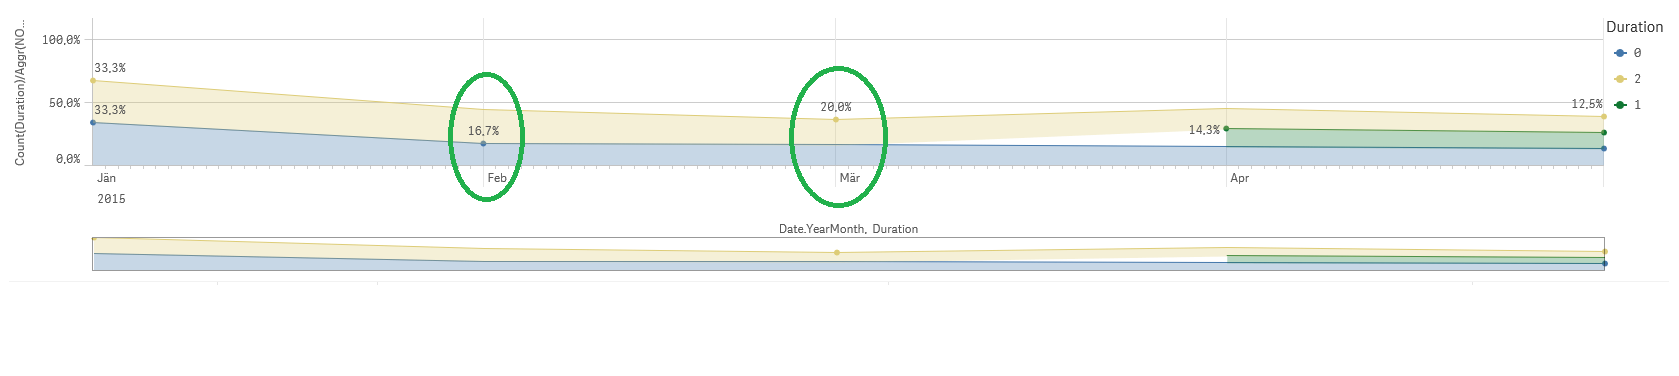
However when I have e.g. in February no datapoint for DURATION = 2, the diagramm shows an additional value. I would prefer a grafic which looks like:
Original grafic from QLIK:
Grafic which I would prefer to get:
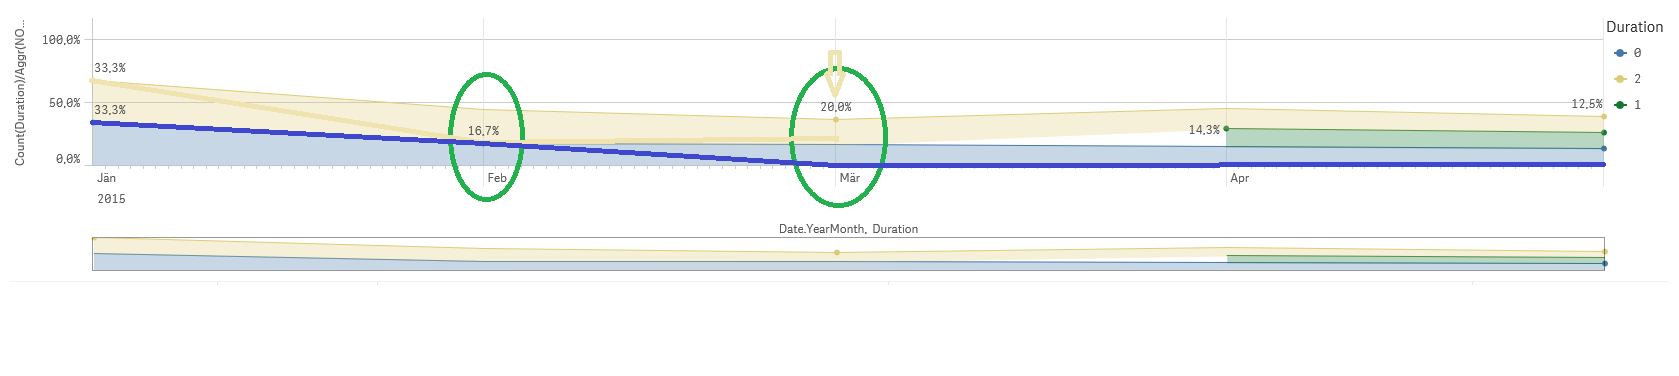
In case of a zero value, the data line should no be stacked with any additional value, so that in case the rate is 20%, the data point should be located at 20% (not a 45% like in the qlik grafics).
Is there any way to chance to change that behaviour of the diagram?
- Mark as New
- Bookmark
- Subscribe
- Mute
- Subscribe to RSS Feed
- Permalink
- Report Inappropriate Content
I am not entirely sure I understand... would you be able to share a sample qvf file to look at this?
- Mark as New
- Bookmark
- Subscribe
- Mute
- Subscribe to RSS Feed
- Permalink
- Report Inappropriate Content
Hi,
please find attached my qvf file.
What I need, is that in case I've no datapoint in one month the diagram reflects this in the stacked form as a zero value. At the moment there is a constant value of the line, where all additional datapoints are added.
I hope my problem is understandable with my qvf file.
Thanks!
- Mark as New
- Bookmark
- Subscribe
- Mute
- Subscribe to RSS Feed
- Permalink
- Report Inappropriate Content
I don't have the file to re-run your dashboard, but what you essentially need is this