Unlock a world of possibilities! Login now and discover the exclusive benefits awaiting you.
- Qlik Community
- :
- Forums
- :
- Analytics
- :
- App Development
- :
- Line chart showing Daily and Monthly average
- Subscribe to RSS Feed
- Mark Topic as New
- Mark Topic as Read
- Float this Topic for Current User
- Bookmark
- Subscribe
- Mute
- Printer Friendly Page
- Mark as New
- Bookmark
- Subscribe
- Mute
- Subscribe to RSS Feed
- Permalink
- Report Inappropriate Content
Line chart showing Daily and Monthly average
This is probably trivial and I bet lots of users have faced this before, but I can't seem to find a relevant discussion on this.
I want to be able to show in a line chart both the daily values and a stepped line showing the monthly (or weekely) average.
The current application analyzes the times spent by employees in the office.
The data is based on gates access timestamps, and the transactions table looks like this:
| BadgeID | Gate_Access |
|---|---|
| ID1 | Day1/Time1 |
| Day1/Time2 | |
| Day1/Time3 | |
| Day1/Time4 etc | |
| ID1 | Day2/Time1 |
| Day2/Time2 etc | |
| ID2 etc |
So for each ID, for each day, I have multiple gate access times.
With a reasonable approximation I will consider the time spent by each employee as the Max-Min for each day. I will then need to aggregate this further up at Month level or Department Level based on the Median
I calculated this as follows:
Median( aggr(max(Gate_Access)-min(Gate_Access), [BadgeID-Badge ID], [Gate_Access.autoCalendar.Date]))
Works perfectly and is correctly aggregated at all needed levels
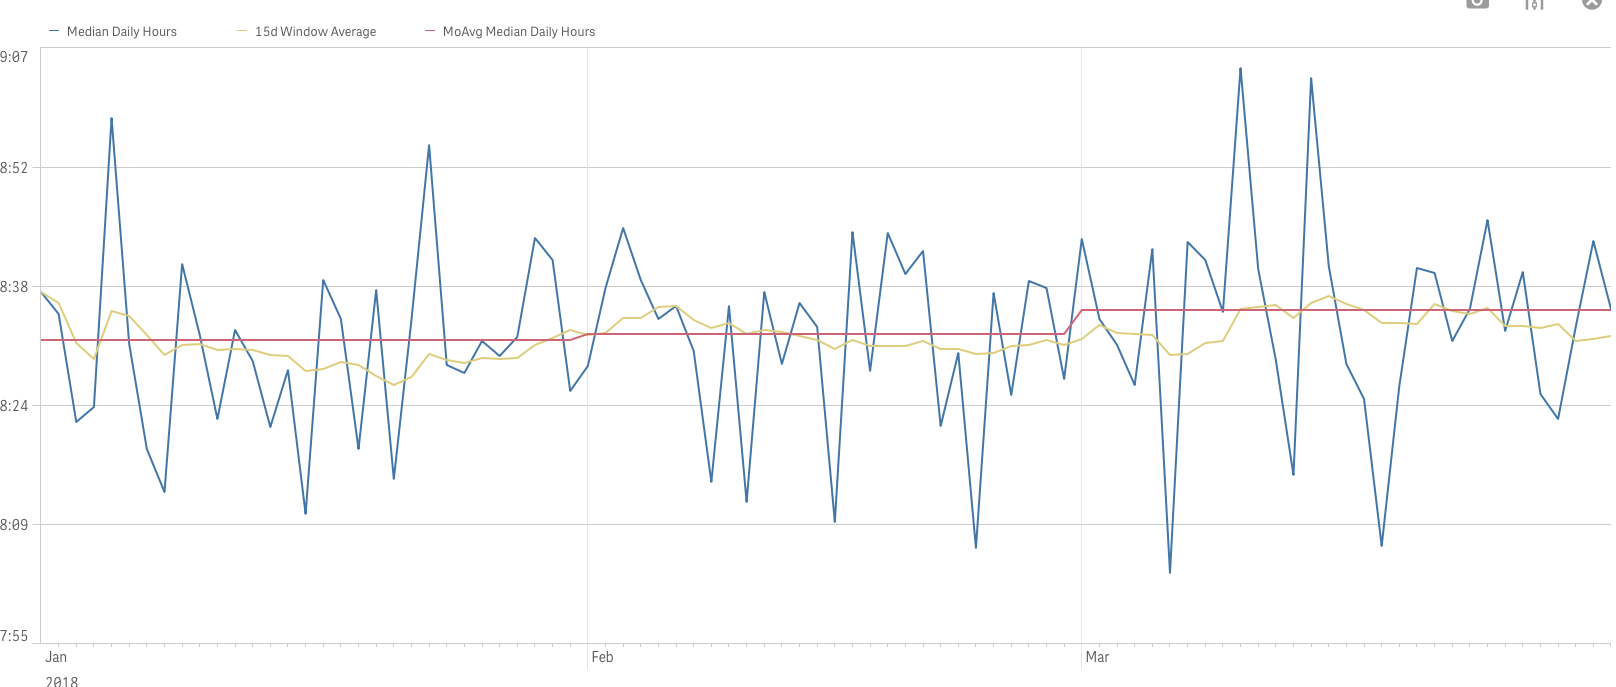
I then want to plot this as a daily line chart, but I also want to show the Monthly average (as a stepped line).
I was able to calculate the monthly average as follows:
Avg(aggr(Median( aggr(max(Gate_Access)-min(Gate_Access), [BadgeID-Badge ID], [Gate_Access.autoCalendar.Date])), [Gate_Access.autoCalendar.YearMonth]))
However, this only calculates one value, against the start of the Month, and looks like this on the line chart - the red dot (the yellow line is a Window average):
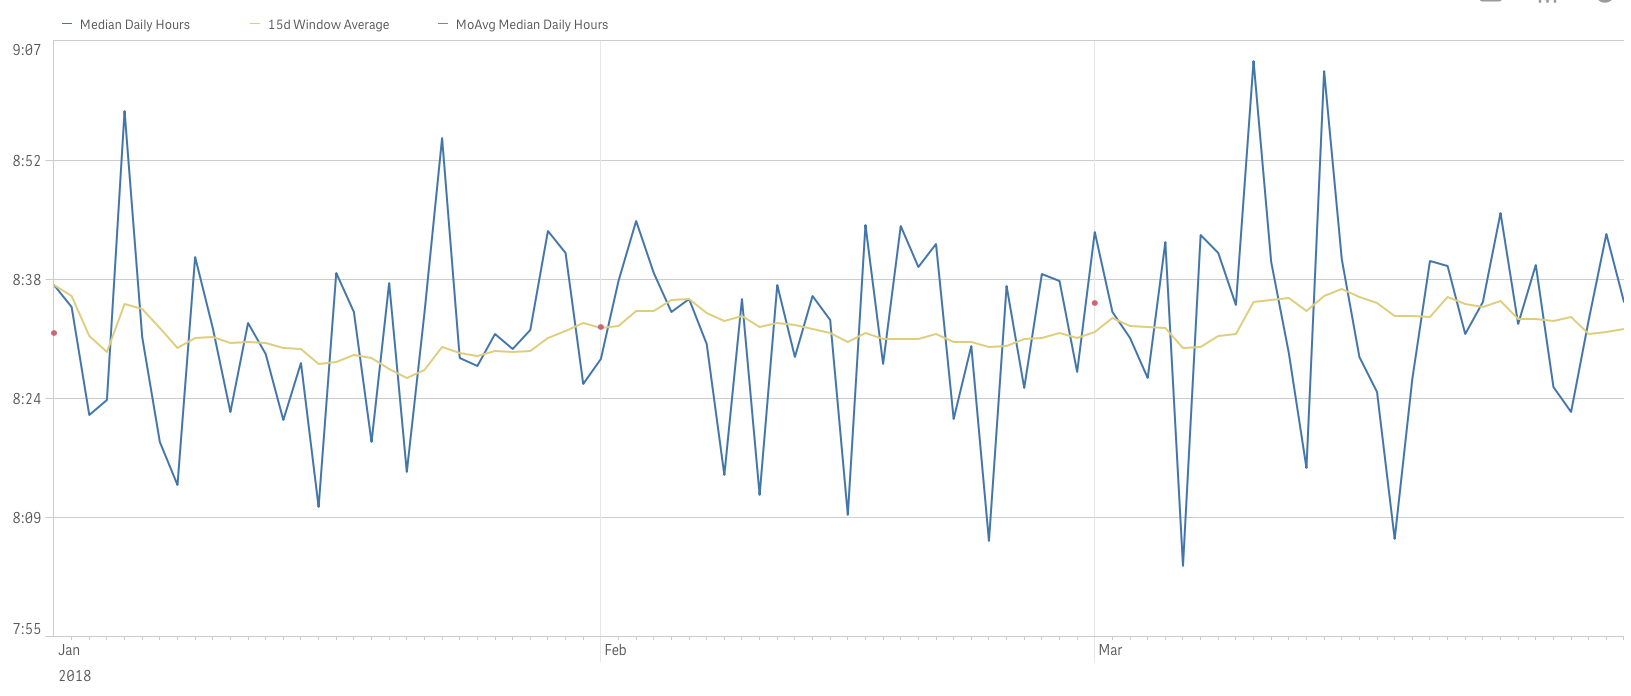
How can I write the expression so it uses the day granularity , but using the monthly average?
Accepted Solutions
- Mark as New
- Bookmark
- Subscribe
- Mute
- Subscribe to RSS Feed
- Permalink
- Report Inappropriate Content
May be try this
Avg(Aggr(NODISTINCT Median( aggr(max(Gate_Access)-min(Gate_Access), [BadgeID-Badge ID], [Gate_Access.autoCalendar.Date])), [Gate_Access.autoCalendar.YearMonth]))
or this
Avg(TOTAL <[Gate_Access.autoCalendar.YearMonth]> Aggr(Median( aggr(max(Gate_Access)-min(Gate_Access), [BadgeID-Badge ID], [Gate_Access.autoCalendar.Date])), [Gate_Access.autoCalendar.YearMonth], [Gate_Access.autoCalendar.Date]))
- Mark as New
- Bookmark
- Subscribe
- Mute
- Subscribe to RSS Feed
- Permalink
- Report Inappropriate Content
Thanks Sunny,
The second one doesn't work, it calculates a straight line across the whole date dimension (average across all dates)
The first one does the trick perfectly!