Unlock a world of possibilities! Login now and discover the exclusive benefits awaiting you.
- Qlik Community
- :
- Forums
- :
- Analytics
- :
- App Development
- :
- Re: Missing label on last X axis value for line ch...
- Subscribe to RSS Feed
- Mark Topic as New
- Mark Topic as Read
- Float this Topic for Current User
- Bookmark
- Subscribe
- Mute
- Printer Friendly Page
- Mark as New
- Bookmark
- Subscribe
- Mute
- Subscribe to RSS Feed
- Permalink
- Report Inappropriate Content
Missing label on last X axis value for line chart
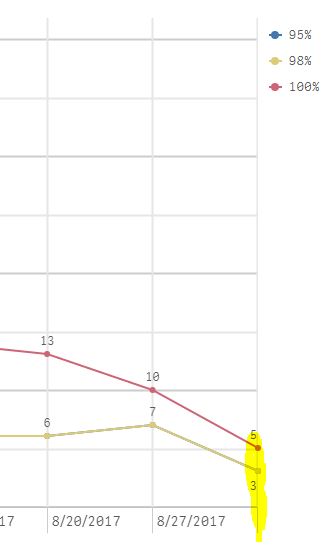
Hi, I have a line chart that shows data based on week with the week starting on Sunday. The X axis label for the most recent week displays the data points but does not display the label. The date for the week is brought in as part of the base data in the load query and not calculated in the analytic. In the example below there should be a label for the week of 9/3. Thanks in advance for any ideas or insights.
Accepted Solutions
- Mark as New
- Bookmark
- Subscribe
- Mute
- Subscribe to RSS Feed
- Permalink
- Report Inappropriate Content
Did you try by unchecking continuous Scale in X Axis?
- Mark as New
- Bookmark
- Subscribe
- Mute
- Subscribe to RSS Feed
- Permalink
- Report Inappropriate Content
Did you try by unchecking continuous Scale in X Axis?
- Mark as New
- Bookmark
- Subscribe
- Mute
- Subscribe to RSS Feed
- Permalink
- Report Inappropriate Content
Hi Wayne,
This is a bug that's been fixed. The current estimate is that it will be part of the November 2017 release.
Best regards,
Patrik.
- Mark as New
- Bookmark
- Subscribe
- Mute
- Subscribe to RSS Feed
- Permalink
- Report Inappropriate Content
Hi Shraddha, thank you for the reply. That worked! Thought I had tried it already but I think I only changed it from auto to custom and didn't uncheck use continous scale. Thanks again.
- Mark as New
- Bookmark
- Subscribe
- Mute
- Subscribe to RSS Feed
- Permalink
- Report Inappropriate Content
Hi Patrik, thank you for the reply. Ok, good to know it will be fixed in an upcoming release. Shradda's suggestion above worked as a workaround for now.