Unlock a world of possibilities! Login now and discover the exclusive benefits awaiting you.
- Qlik Community
- :
- Forums
- :
- Analytics
- :
- App Development
- :
- Missing value vs null value
- Subscribe to RSS Feed
- Mark Topic as New
- Mark Topic as Read
- Float this Topic for Current User
- Bookmark
- Subscribe
- Mute
- Printer Friendly Page
- Mark as New
- Bookmark
- Subscribe
- Mute
- Subscribe to RSS Feed
- Permalink
- Report Inappropriate Content
Missing value vs null value
Hi,
I'm calculating percentage margin. The formula is as simple as:
margin (percentage) = margin (value) / sales (value)
But when sale (value) <= 0 or sale cost = 0 the margin (percentage) makes no sense (it gives huge negative numbers, which disturbs analysis). So I want to get rid of that. I did that by following:
margin (percentage) = if( sales (value) <= 0 or sale cost = 0, null, margin (value) / sales (value))
I almost works. Almost because that null value i put, doesn't count as missing value somehow (therefore when i uncheck "Include null values" in any dimension on graph/chart - they are included nonetheless).
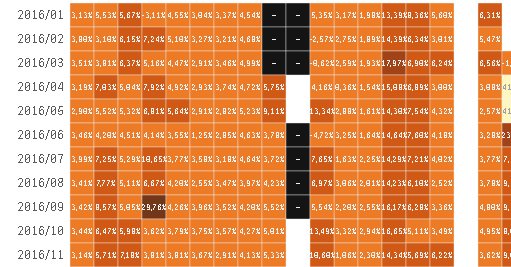
2 dimensional heatmap shows that perfectly (black with "-" are my NULLs, while blank, white squares are actual missing values (no sales within current month for given dimension, which is product manager in that case):
Any ideas how to make my NULLs act like actual missing values?
- Tags:
- missing value
- null