Unlock a world of possibilities! Login now and discover the exclusive benefits awaiting you.
- Qlik Community
- :
- Forums
- :
- Analytics
- :
- App Development
- :
- Re: MoM and YTD Trend..
- Subscribe to RSS Feed
- Mark Topic as New
- Mark Topic as Read
- Float this Topic for Current User
- Bookmark
- Subscribe
- Mute
- Printer Friendly Page
- Mark as New
- Bookmark
- Subscribe
- Mute
- Subscribe to RSS Feed
- Permalink
- Report Inappropriate Content
MoM and YTD Trend..
Hi..
I want to show below expression in line chart...
sum({<Val_Date={">=$(vValStart)<=$(vValEnd)"}>}if(vCalCurrentDate< Val_Date,[Net Tractor Revenue (Domestic)]))
/
sum( {<Link_Date={">=$(vCalMinDate)<=$(vCalCurrentDate)"}>} [Net Tractor Revenue (Domestic)])
Please help me with this issue.
Regards,
Kavita
- « Previous Replies
-
- 1
- 2
- Next Replies »
- Mark as New
- Bookmark
- Subscribe
- Mute
- Subscribe to RSS Feed
- Permalink
- Report Inappropriate Content
When you say line chat...
1) What are the dimension(s) you are going to use in Line Chart?
2) What exactly the logic behind this expression?
Regards,
MK
- Mark as New
- Bookmark
- Subscribe
- Mute
- Subscribe to RSS Feed
- Permalink
- Report Inappropriate Content
My calendar is not linked with the data..
The logic is..
I want to calculate those revenue..whose validity date falls under this year... divided by total revenue..which is calculated on the basis of another field..
I have attached sample app..kindly look into it..
- Mark as New
- Bookmark
- Subscribe
- Mute
- Subscribe to RSS Feed
- Permalink
- Report Inappropriate Content
What are the dimension(s) you are going to use for Line Chart?
- Mark as New
- Bookmark
- Subscribe
- Mute
- Subscribe to RSS Feed
- Permalink
- Report Inappropriate Content
Yes, Please specify the dimension names in line chart
- Mark as New
- Bookmark
- Subscribe
- Mute
- Subscribe to RSS Feed
- Permalink
- Report Inappropriate Content
I guess a lot of people before me have asked the same question about what is the dimension here. I would like to additionally ask you about what is the expected output in terms of numbers you want to see for each month and probably break it down in terms of number in the numerator and number in denominator. The more info you can provide, the easier it will be for us to play around in your sample because those are things we don't know.
Best,
Sunny
- Mark as New
- Bookmark
- Subscribe
- Mute
- Subscribe to RSS Feed
- Permalink
- Report Inappropriate Content
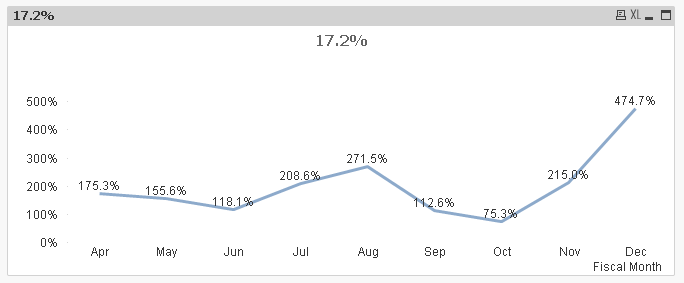
Hi..I want to show Month Wise trend..
But my calendar is not linked with the data..
I have two dates Link_Date and Val_Date from data and LinkDate is from Calendar.
The calculation is...sum of revenue with the Val_Date divided by sum revenue with the Link_Date.
My filters are from Calendar.
I hope now u understand it better...
Please help me with this issue.. I have attached the sample app also.
Kindly look into it.
Regards,
Kavita
- Mark as New
- Bookmark
- Subscribe
- Mute
- Subscribe to RSS Feed
- Permalink
- Report Inappropriate Content
- Mark as New
- Bookmark
- Subscribe
- Mute
- Subscribe to RSS Feed
- Permalink
- Report Inappropriate Content
I think you cannot use set analysis in your denominator because you are hoping to get it evaluated based on your dimension and set analysis is evaluated only once per chart. The expression which is working is very slow (at least for the sample), but you can give it a try
=Num(Sum({<Val_Date={">=$(vValStart)<=$(vValEnd)"}>} If(vCalCurrentDate < Val_Date,[Net Tractor Revenue (Domestic)]))
/
Sum(Aggr(If(Link_Date >= Min(LinkDate) and Link_Date <= Max(LinkDate), Sum([Net Tractor Revenue (Domestic)])), Link_Date, [Fiscal Month])),'##.#%')
- Mark as New
- Bookmark
- Subscribe
- Mute
- Subscribe to RSS Feed
- Permalink
- Report Inappropriate Content
Thank You Sunny..
MoM Is done..But how Can I show YTD or QTD.. with the same expression...
For e.g
YTD: If is Select Jul then it should show Apr to Jul.
QTD:If is Select Jul then it should show only Jul.
Regards,
Kavita
- « Previous Replies
-
- 1
- 2
- Next Replies »