Unlock a world of possibilities! Login now and discover the exclusive benefits awaiting you.
- Qlik Community
- :
- Forums
- :
- Analytics
- :
- App Development
- :
- Re: Network Flow Map Chart
- Subscribe to RSS Feed
- Mark Topic as New
- Mark Topic as Read
- Float this Topic for Current User
- Bookmark
- Subscribe
- Mute
- Printer Friendly Page
- Mark as New
- Bookmark
- Subscribe
- Mute
- Subscribe to RSS Feed
- Permalink
- Report Inappropriate Content
Network Flow Map Chart
Hi all,
I was wondering whether it is possible to create a flow chart on top of a map with Qlik Sense. Similar to what Matthew Crowther build with QV (New Qlikview Chart Type: Dynamic Network Flow Charts | QVDesign).
I was not able to find any extension that could show connections between origin/destination geo data points.
Best,
David
Accepted Solutions
- Mark as New
- Bookmark
- Subscribe
- Mute
- Subscribe to RSS Feed
- Permalink
- Report Inappropriate Content
Hi David,
Its absolutely possible to develop one like that. And I would assume it would be even easier to build it using D3.js .
But you cannot have on top of the existing map object though. You will be needing a new visual altogether to achieve this.
Thanks,
Sangram
- Mark as New
- Bookmark
- Subscribe
- Mute
- Subscribe to RSS Feed
- Permalink
- Report Inappropriate Content
Hello David,
Sangram is correct, but please let us know if you require more information.
Please mark the appropriate replies as CORRECT / HELPFUL so our team and other members know that your question(s) has been answered to your satisfaction.
Regards,
Mike Tarallo
Qlik
Mike Tarallo
Qlik
- Mark as New
- Bookmark
- Subscribe
- Mute
- Subscribe to RSS Feed
- Permalink
- Report Inappropriate Content
Hi David,
Fyi, just so you know IdevioMaps can show connections as flows both in QlikView and Qlik Sense:
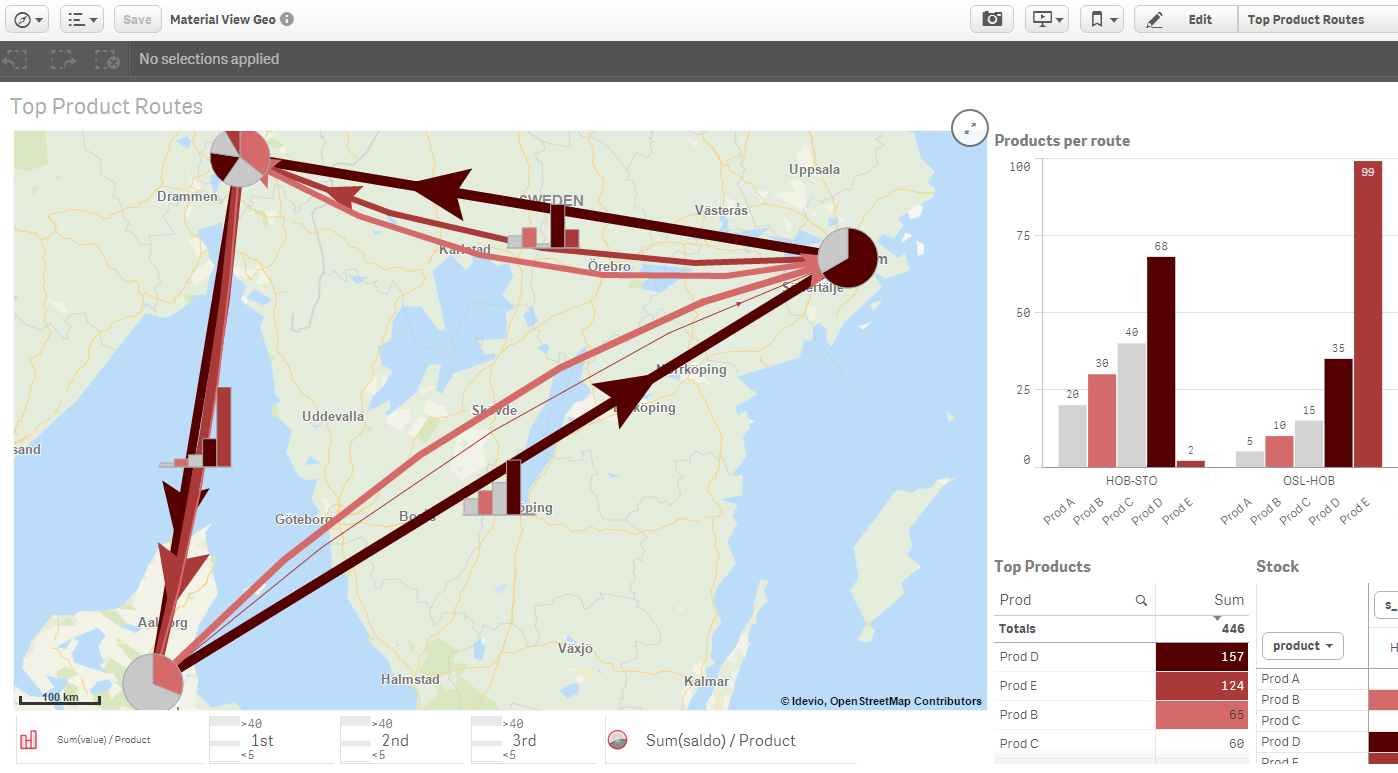
More info and live demos at QlikMarket:
http://market.qlik.com/ideviomaps-for-qlik-sense.html
Thanks,
Patric Nordström, Idevio
- Mark as New
- Bookmark
- Subscribe
- Mute
- Subscribe to RSS Feed
- Permalink
- Report Inappropriate Content
Thanks for the answers and I was hoping there was already a free solution available, but we will look into the priority of this request.
Best regards,
David