Unlock a world of possibilities! Login now and discover the exclusive benefits awaiting you.
- Qlik Community
- :
- Forums
- :
- Analytics
- :
- App Development
- :
- Number Formatting Expression Works in PivotTable b...
- Subscribe to RSS Feed
- Mark Topic as New
- Mark Topic as Read
- Float this Topic for Current User
- Bookmark
- Subscribe
- Mute
- Printer Friendly Page
- Mark as New
- Bookmark
- Subscribe
- Mute
- Subscribe to RSS Feed
- Permalink
- Report Inappropriate Content
Number Formatting Expression Works in PivotTable but not Line/Bar Chart
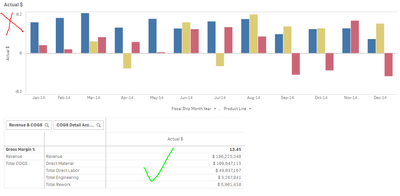
Howdy! This expression is included in my master item to return a number format based on certain conditions in the visual or selections. It works perfectly in my PivotTable but doesn't work at all in the line or bar chart. All charts have the measure set to "auto" number formatting. However, when I replace the function with a standard format, such as '#,##0.0%', it works in the line & bar charts. Any ideas why my custom expression doesn't work in the line/bar chart but does in the pivottable?
- Mark as New
- Bookmark
- Subscribe
- Mute
- Subscribe to RSS Feed
- Permalink
- Report Inappropriate Content
That might work ok for individual values for value labels, but there is only one y axis on these charts, so it can't change based on individual values.
- Mark as New
- Bookmark
- Subscribe
- Mute
- Subscribe to RSS Feed
- Permalink
- Report Inappropriate Content
Lisa,
I appreciate the quick response. In the bar or line chart, only one type ($ or %) of values should be shown at any one time. $ and % will never be mixed but can be one or the other depending on what dimensions are included in the visual. Conditional statements within the measure determine what format encoding to return. Are you saying that bar/line type visuals are able to decipher those conditional formatting statements the same way the PivotTable does?
