Unlock a world of possibilities! Login now and discover the exclusive benefits awaiting you.
- Qlik Community
- :
- Forums
- :
- Analytics
- :
- App Development
- :
- Re: Pareto Analysis
- Subscribe to RSS Feed
- Mark Topic as New
- Mark Topic as Read
- Float this Topic for Current User
- Bookmark
- Subscribe
- Mute
- Printer Friendly Page
- Mark as New
- Bookmark
- Subscribe
- Mute
- Subscribe to RSS Feed
- Permalink
- Report Inappropriate Content
Pareto Analysis
I want to be able to show a Pareto-style analysis of our customers, but at a high-level rather than having to show every customer as we would have to using Henric's solution here: Recipe for a Pareto Analysis – Revisited
I would simply like a metric showing what % of our revenue comes from the Top X% of our customers (say 20%, for example). The only solution I can think of is to rank each customer in the data load, however we want this metric to respond to user selections so don't want to pre-calculate anything.
Any suggestions? 
Alan
Accepted Solutions
- Mark as New
- Bookmark
- Subscribe
- Mute
- Subscribe to RSS Feed
- Permalink
- Report Inappropriate Content
This is a lot simpler then I imagined... Try this
='Top 20% of the Customers are worth ' & Num(Sum({<[Customer ID] = {"=Rank(Sum(Revenue)) < (Count(TOTAL DISTINCT [Customer ID])*0.20) + 1"}>}Revenue)/Sum(Revenue), '##.0%') & ' of total revenue'
- Mark as New
- Bookmark
- Subscribe
- Mute
- Subscribe to RSS Feed
- Permalink
- Report Inappropriate Content
you can use input box to take % from user store it into variable and use this variable in Top x%
Vikas
If the issue is solved please mark the answer with Accept as Solution & like it.
If you want to go quickly, go alone. If you want to go far, go together.
- Mark as New
- Bookmark
- Subscribe
- Mute
- Subscribe to RSS Feed
- Permalink
- Report Inappropriate Content
Would you be able to share some data with the output you are expecting out of it? Also, I hope you are working with QV12.1 or above?
- Mark as New
- Bookmark
- Subscribe
- Mute
- Subscribe to RSS Feed
- Permalink
- Report Inappropriate Content
This is a (very) simplified version of the dataset:
| Store | Customer ID | Order ID | Revenue |
| London | 1 | ABC1 | £190 |
| London | 2 | ABC2 | £87 |
| London | 3 | ABC3 | £163 |
| London | 1 | ABC4 | £93 |
| London | 2 | ABC5 | £91 |
| London | 1 | ABC6 | £58 |
| London | 3 | ABC7 | £99 |
| London | 4 | ABC8 | £218 |
| London | 5 | ABC9 | £195 |
| London | 6 | ABC10 | £176 |
| London | 4 | ABC11 | £76 |
| London | 7 | ABC12 | £204 |
| London | 8 | ABC13 | £56 |
| London | 9 | ABC14 | £64 |
| New York | 10 | ABC15 | £173 |
| New York | 10 | ABC16 | £117 |
| New York | 8 | ABC17 | £90 |
| New York | 10 | ABC18 | £176 |
| New York | 8 | ABC19 | £58 |
| New York | 9 | ABC20 | £132 |
| New York | 10 | ABC21 | £87 |
| New York | 8 | ABC22 | £140 |
| New York | 9 | ABC23 | £193 |
| New York | 10 | ABC24 | £157 |
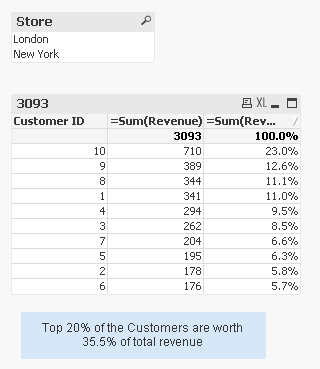
The steps to go through are basically rank the customers in order of their total revenue, then calculate the contribution each on makes to the overall revenue:
| Customer ID | Total Revenue | % Contribution | Cumulative Contribution |
| 10 | £710 | 23.0% | 23.0% |
| 9 | £389 | 12.6% | 35.5% |
| 8 | £344 | 11.1% | 46.7% |
| 1 | £341 | 11.0% | 57.7% |
| 4 | £294 | 9.5% | 67.2% |
| 3 | £262 | 8.5% | 75.7% |
| 7 | £204 | 6.6% | 82.3% |
| 5 | £195 | 6.3% | 88.6% |
| 2 | £178 | 5.8% | 94.3% |
| 6 | £176 | 5.7% | 100.0% |
| Grand Total | £3,093 |
From there, I can now say the top 20% of customers (in this case just customers 9 and 10) contribute 35.5% of our revenue.
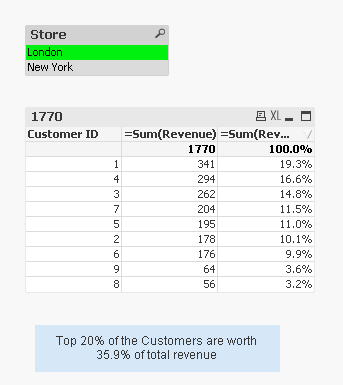
But, I also want this to react to user selections, so if we filter to just London orders, the data would look like this:
| Customer ID | Total Revenue | % Contribution | Cumulative Contribution |
| 1 | £341 | 19.3% | 19.3% |
| 4 | £294 | 16.6% | 35.9% |
| 3 | £262 | 14.8% | 50.7% |
| 7 | £204 | 11.5% | 62.2% |
| 5 | £195 | 11.0% | 73.2% |
| 2 | £178 | 10.1% | 83.3% |
| 6 | £176 | 9.9% | 93.2% |
| 9 | £64 | 3.6% | 96.8% |
| 8 | £56 | 3.2% | 100.0% |
| Grand Total | £1,770 |
And, as we have over 300,000 customers, I don't want to show as a table/chart with a record for individual customers, but just a high level metric to say the top 20% of customers are worth Y% of total revenue.
Hope that helps!
Alan
- Mark as New
- Bookmark
- Subscribe
- Mute
- Subscribe to RSS Feed
- Permalink
- Report Inappropriate Content
This is a lot simpler then I imagined... Try this
='Top 20% of the Customers are worth ' & Num(Sum({<[Customer ID] = {"=Rank(Sum(Revenue)) < (Count(TOTAL DISTINCT [Customer ID])*0.20) + 1"}>}Revenue)/Sum(Revenue), '##.0%') & ' of total revenue'
- Mark as New
- Bookmark
- Subscribe
- Mute
- Subscribe to RSS Feed
- Permalink
- Report Inappropriate Content
Works perfectly, thanks Sunny!
- Mark as New
- Bookmark
- Subscribe
- Mute
- Subscribe to RSS Feed
- Permalink
- Report Inappropriate Content
Hi both,
How to realize below Pareto analysis?
Thanks,
| Customer ID | Total Revenue | % Contribution | Cumulative Contribution |
| 10 | £710 | 23.0% | 23.0% |
| 9 | £389 | 12.6% | 35.5% |
| 8 | £344 | 11.1% | 46.7% |
| 1 | £341 | 11.0% | 57.7% |
| 4 | £294 | 9.5% | 67.2% |
| 3 | £262 | 8.5% | 75.7% |
| 7 | £204 | 6.6% | 82.3% |
| 5 | £195 | 6.3% | 88.6% |
| 2 | £178 | 5.8% | 94.3% |
| 6 | £176 | 5.7% | 100.0% |
| Grand Total | £3,093 |
- Mark as New
- Bookmark
- Subscribe
- Mute
- Subscribe to RSS Feed
- Permalink
- Report Inappropriate Content
- Mark as New
- Bookmark
- Subscribe
- Mute
- Subscribe to RSS Feed
- Permalink
- Report Inappropriate Content
Hi sunny ,
I tried to apply same expression in my Qlik sense app but it does not work for me. I have similar requirement, Only that I have to apply same pareto analysis on Parent_supplier_ID and need to count supplier whose contribution on total sales is 80%.
I am currently using below expression for this calculation , which I created based on the Pareto analysis - revisited article. My below expression fails to include the parent_supplier_ID when the filter changes.
count(distinct aggr(if(RangeSum(Above(SUM({<Period=,Date={">=01/01/2019<=30/06/2019"}>}SPEND_ACTUAL), 0, RowNo()))/sum( {<Period=,Date={">=01/01/2019<=30/06/2019"}>} TOTAL SPEND_ACTUAL)<=0.80,PARENT_SUPPLIER_ID),
(PARENT_SUPPLIER_ID,(=SUM({<Period=,Date={">=01/01/2019<=30/06/2019"}>}SPEND_ACTUAL),Desc))))
This expression fails when I select period in Period Filter. It only calculates the aggregated spend % for that selected Period while as per the expression , it should avoid the period filter and only filter on date .
Please suggest the fix for this issue or if there any other way to perform the same analysis without aggr() function it self.
thank you in advance.