Unlock a world of possibilities! Login now and discover the exclusive benefits awaiting you.
- Qlik Community
- :
- Forums
- :
- Analytics
- :
- App Development
- :
- Pick the sum of highest four values
- Subscribe to RSS Feed
- Mark Topic as New
- Mark Topic as Read
- Float this Topic for Current User
- Bookmark
- Subscribe
- Mute
- Printer Friendly Page
- Mark as New
- Bookmark
- Subscribe
- Mute
- Subscribe to RSS Feed
- Permalink
- Report Inappropriate Content
Pick the sum of highest four values
Hi all,
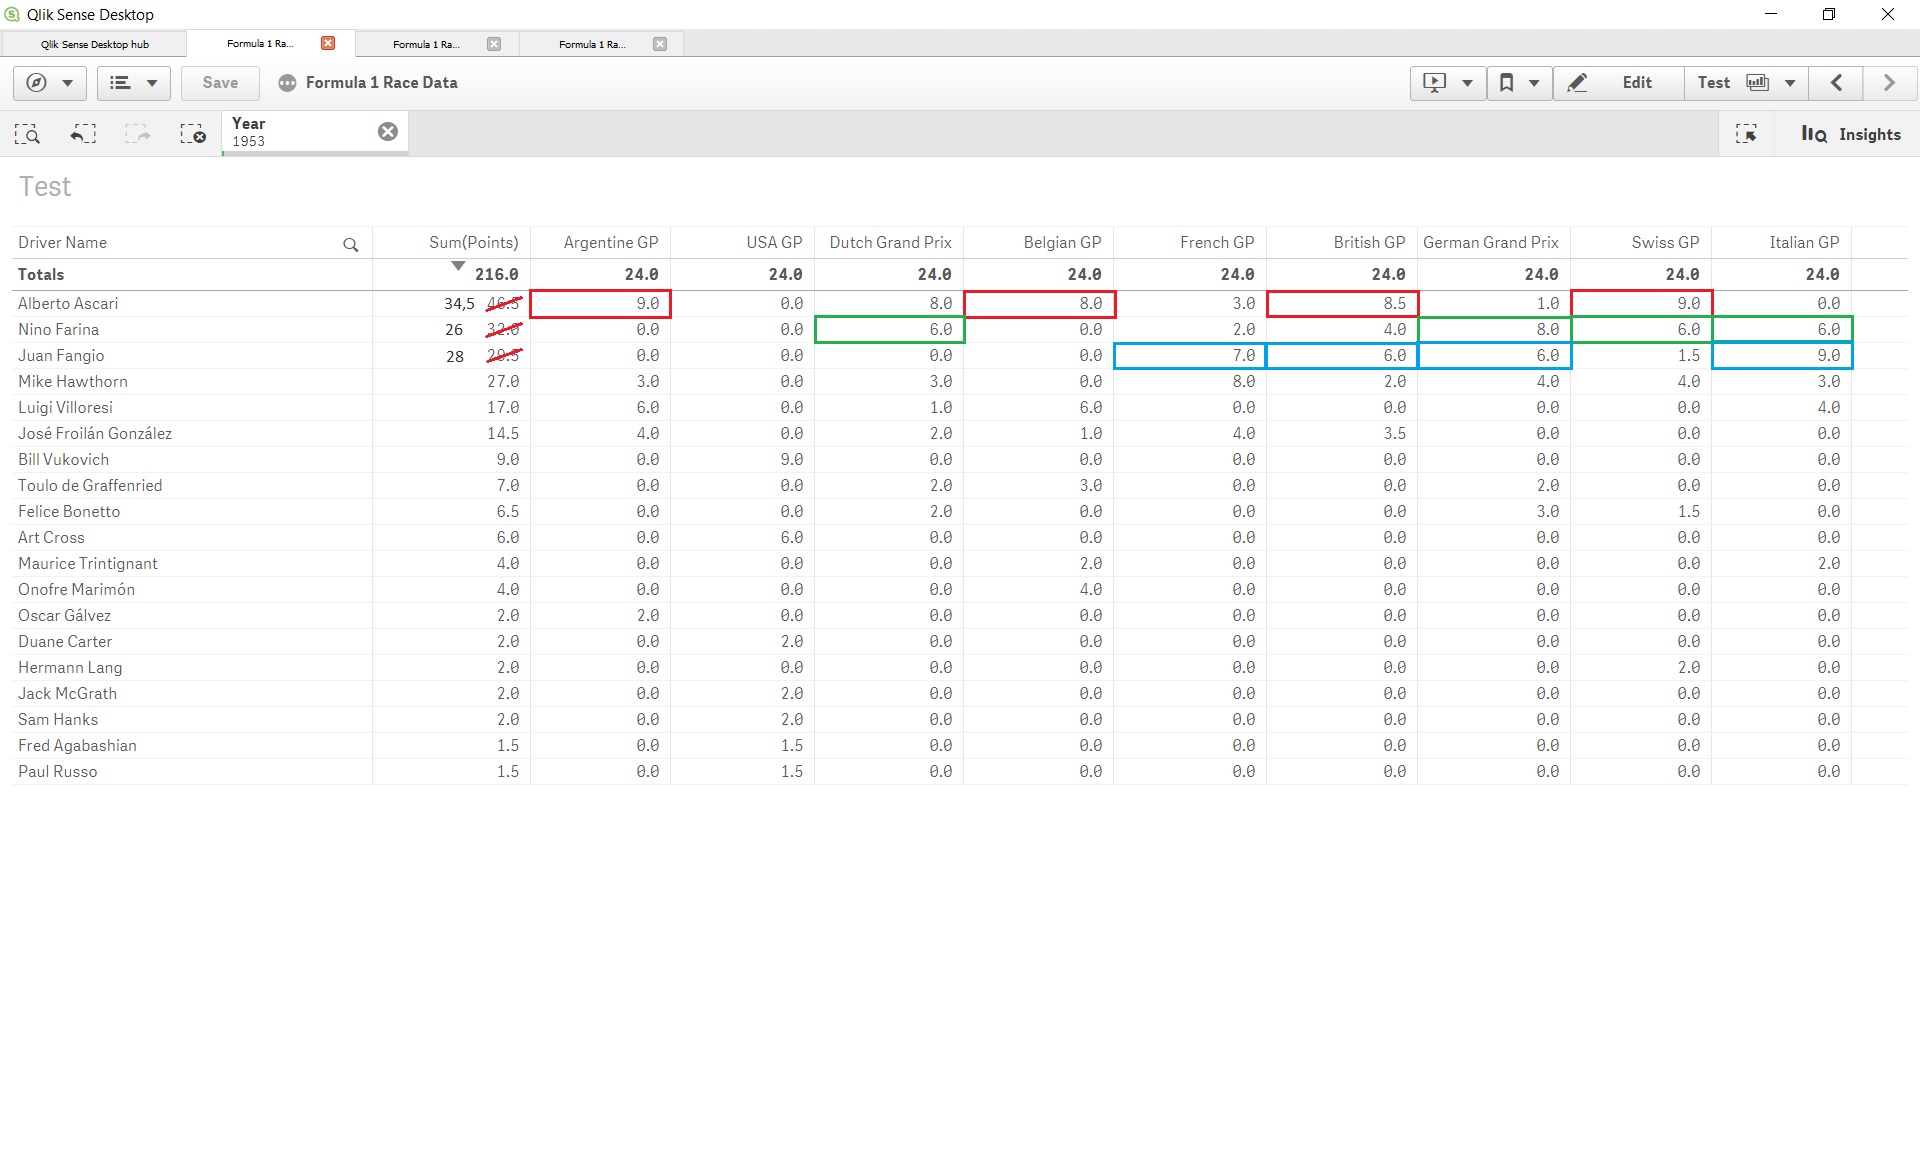
I have a question about my Formula 1 dashboard once again. In the history of Formula 1 they used many pointing systems. For example, in the beginning years (I've taken 1953 for this example) only the four best results out of the nine grand prix' that year has been counted for the world championship. My data exists of the earned points of all GP's that year, so when I sum the totals I will get a different total points than the 'real' deserved points. To get the right sum of points I want to pick only the highest four point values and sum those points.
As you can see in the picture below, Nino Farina earned a total of 32 points that season, but because of only his best four results will be counted he got 6 dropped points and end up with 26 points. Juan Fangio earned that season a total of 29.5 points, but only 1.5 points of them will be dropped, so he ends with a total of 28 points and a 2nd place in the championship.
To be honest I have no idea which functions to use in the expression to get the right result. Or is it maybe better to script it in the data load editor? Could anyone help me further?
Thanks in advance! 🙂
- Mark as New
- Bookmark
- Subscribe
- Mute
- Subscribe to RSS Feed
- Permalink
- Report Inappropriate Content
can you share sample data/app?
- Mark as New
- Bookmark
- Subscribe
- Mute
- Subscribe to RSS Feed
- Permalink
- Report Inappropriate Content
Hello,
Maybe try
/*** Assuming the columns are from the same table **/
Source:
LOAD
*,
Year &'|' & Name as Key;
LOAD * INLINE [
Year, Name, Race, Points
2015, 1, A, 9
2015, 1, B, 6
2015, 1, C, 2
2015, 1, D, 12
2015, 1, E, 10
2015, 1, F, 5
2015, 2, A, 3
2015, 2, B, 5
2015, 2, C, 6
2015, 2, D, 8
2015, 2, E, 9
2015, 2, F, 0
2015, 3, A, 7
2015, 3, B, 6
2015, 3, C, 9
2015, 3, D, 8
2015, 3, E, 3
2015, 3, F, 1
2015, 4, A, 8
2015, 4, B, 9
2015, 4, C, 4
2015, 4, D, 6
2015, 4, E, 8
2015, 4, F, 7
];
Max_Table:
LOAD
Key &'|'& Max(Points)as Key_new,
1 as Flag
Resident Source
Group by
Key;
Concatenate(Max_Table)
LOAD
Key&'|'&Max(Points,2)as Key_new,
1 as Flag
Resident Source
Group by
Key;
Concatenate(Max_Table)
LOAD
Key&'|'&Max(Points,3)as Key_new,
1 as Flag
Resident Source
Group by
Key;
Concatenate(Max_Table)
LOAD
Key&'|'&Max(Points,4)as Key_new,
1 as Flag
Resident Source
Group by
Key;
DROP Field Key;
Max_Points_Flag:
Mapping LOAD
Key_new,
Flag
Resident Max_Table;
DROP Table Max_Table;
Final_Table:
LOAD
*,
Applymap( 'Max_Points_Flag', Year &'|' & Name &'|' & Points,0) as Max_Points_Flag
Resident Source;
Drop Table Source;
Expression in the chart would be: SUM({<Max_Points_Flag={1}>}Points)
- Mark as New
- Bookmark
- Subscribe
- Mute
- Subscribe to RSS Feed
- Permalink
- Report Inappropriate Content
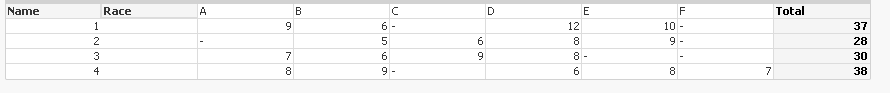
It might be easier to do a CrossTable Load in the script:
crosstable (Race, Points) Load * From...;
This will create a table with three fields: Driver Name, Race, Points. This assumes that Driver Name is the first field in the source data and that the race names are subsequent fields, as they appear in your screenshot.
This new format would allow you to use a chart function to choose the top 4 races for each driver.