Unlock a world of possibilities! Login now and discover the exclusive benefits awaiting you.
- Qlik Community
- :
- Forums
- :
- Analytics
- :
- App Development
- :
- Pivot Table Help
- Subscribe to RSS Feed
- Mark Topic as New
- Mark Topic as Read
- Float this Topic for Current User
- Bookmark
- Subscribe
- Mute
- Printer Friendly Page
- Mark as New
- Bookmark
- Subscribe
- Mute
- Subscribe to RSS Feed
- Permalink
- Report Inappropriate Content
Pivot Table Help
Hi Guys,
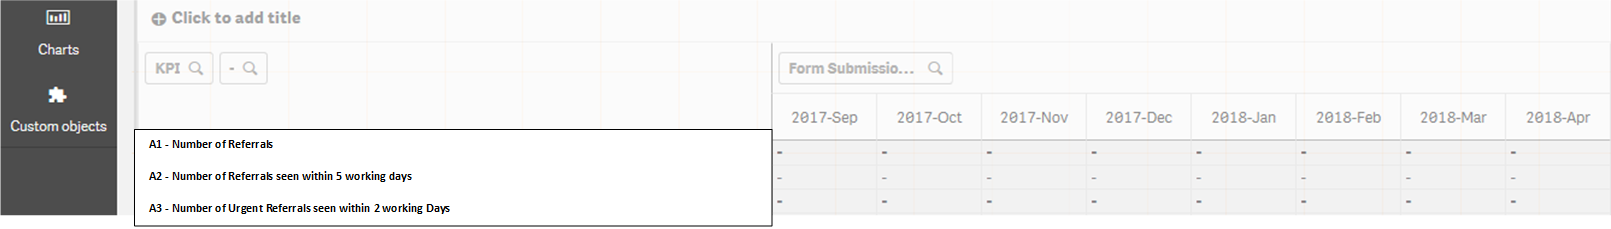
I'm currently creating a Pivot table to show the results of multiple KPI's broken down by month.
My Rows are the KPI's themselves i.e.
Ref Name
---------------------------------------------------------------------------------
A1 Number of Referrals
A2 Number of Referrals seen within 5 working days
A3 Number of Urgent Referrals seen within 2 working Days
My Columns are the form submission months i.e.
2017 Sept 2017 Oct 2017 Nov
So I end up with the Pivot Table looking how I want it like this.....
However, when I insert my formula for the Measures it does not work....
I'm currently going with something like this....
=if(Ref='A1',Count([Referral ID]),
if(Ref='A2',Sum(Aggr(If(NetWorkDays("Submission date", "Start Time", '25/12/2017','26/12/2017','01/01/2018','01/01/2018') <= 6, 1, 0),[Referral ID])),
if(Ref='A3',Sum(Aggr(If(NetWorkDays("Submission date", "Start Time", '25/12/2017','26/12/2017','01/01/2018','01/01/2018') <= 3, 1, 0),[Referral ID]))))
And I'm either getting blanks or numbers that are completely off.
I know these formulas on their own work as I've created them using the KPI chart in Qlik with the correct values. It appears to be an issue with the way I've set the pivot table up.
Any help would be much appreciated 
- Mark as New
- Bookmark
- Subscribe
- Mute
- Subscribe to RSS Feed
- Permalink
- Report Inappropriate Content
Any help with this one would be great, its abit of a stumbling block for my work.
- Mark as New
- Bookmark
- Subscribe
- Mute
- Subscribe to RSS Feed
- Permalink
- Report Inappropriate Content
I think you should make a straight table and then use fieldvaluelist() and pick() functions to get this to work. There are some threads about them. So you might find them by searching those functions. Sorry I couldn't be of more help, hope this is enough to get you in the right direction.