Unlock a world of possibilities! Login now and discover the exclusive benefits awaiting you.
- Qlik Community
- :
- Forums
- :
- Analytics
- :
- App Development
- :
- Pivot Table and After Function
- Subscribe to RSS Feed
- Mark Topic as New
- Mark Topic as Read
- Float this Topic for Current User
- Bookmark
- Subscribe
- Mute
- Printer Friendly Page
- Mark as New
- Bookmark
- Subscribe
- Mute
- Subscribe to RSS Feed
- Permalink
- Report Inappropriate Content
Pivot Table and After Function
hi All,
I have been discussing a challenging request on the QlikView Side. Now I need to do the same thing in Sense.
Attached is a QlikView and a QlikSense Document and both of them have the same pivot table. on QlikView the logic works fine but on Sense it doesnt.
my request is as follow
the source is the upper table which looks like
| 5/18/2016 | test | $ 254.00 |
| 6/15/2016 | test | $ 200.00 |
| 7/20/2016 | test | $ 500.00 |
| 8/17/2016 | test | $ 300.00 |
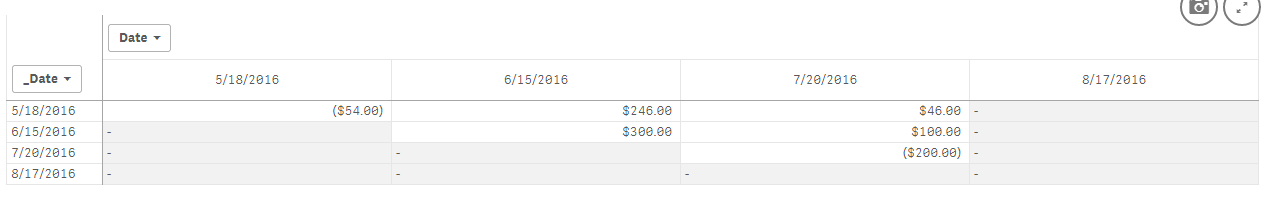
and the result table is as follow
| Date | 5/18/2016 | 6/15/2016 | 7/20/2016 |
| 5/18/2016 | $ (54.00) | $ 246.00 | $ 46.00 |
| 6/15/2016 | $ 300.00 | $ 100.00 | |
| 7/20/2016 | $ (200.00) |
Let me know if anyone knows how to handle it in Sense..
- « Previous Replies
-
- 1
- 2
- Next Replies »
Accepted Solutions
- Mark as New
- Bookmark
- Subscribe
- Mute
- Subscribe to RSS Feed
- Permalink
- Report Inappropriate Content
I know you did not like the second method, but that one works in QlikSense
- Mark as New
- Bookmark
- Subscribe
- Mute
- Subscribe to RSS Feed
- Permalink
- Report Inappropriate Content
I think there is a difference in that QlikSense doesn't calculate aggregations with TOTAL qualifier in your pivot table chart the same way as QlikView.
Try your pivot table chart with an expression
=Sum(TOTAL Value)
You only get the expression evaluated where both dates are the same (in QS), while QV shows the value in every cell.
Not sure why there is this difference (at least for this specific scenario), maybe mto can shed some light on this.
(Maybe this is a known issue)
I tried some other approaches, but always struggled somewhere around this different behaviour.
(I think the approach with mostly duplicating your fact as Sunny suggested first in the other thread should work, but that's not what you want, right?)
- Mark as New
- Bookmark
- Subscribe
- Mute
- Subscribe to RSS Feed
- Permalink
- Report Inappropriate Content
hi Stephan,
agree , Sum(TOTAL Value) returns the values only for the matching dates. but tht doesn't help  .
.
I am fine to duplicate the table knowing that it is the only solution but it didnt work for me either. Have you tried it? and if it worked for you, can you please send me a QVF sample.
Thanks for all the help.
Alec
- Mark as New
- Bookmark
- Subscribe
- Mute
- Subscribe to RSS Feed
- Permalink
- Report Inappropriate Content
Actually, It worked on my end.
Thanks,
Alec
- Mark as New
- Bookmark
- Subscribe
- Mute
- Subscribe to RSS Feed
- Permalink
- Report Inappropriate Content
while this works well for me.. the issue is when having multiple dimensions it doesnt work.. any idea what could be the reason?
- Mark as New
- Bookmark
- Subscribe
- Mute
- Subscribe to RSS Feed
- Permalink
- Report Inappropriate Content
I have been trying it with Qlik Sense as well, not sure why the TOTAL doesn't work. Have you tried the first alternative?
- Mark as New
- Bookmark
- Subscribe
- Mute
- Subscribe to RSS Feed
- Permalink
- Report Inappropriate Content
I know you did not like the second method, but that one works in QlikSense
- Mark as New
- Bookmark
- Subscribe
- Mute
- Subscribe to RSS Feed
- Permalink
- Report Inappropriate Content
hi Sunny,
the first solution is ok with me since it is the only option we have.
the issue is how do I handle multiple dimensions and facts available on the table.
Attached is a better sample of the data I have. I didn't include all the dimensions and facts I have on it but if I can get this to work then I can take care of it.
- Mark as New
- Bookmark
- Subscribe
- Mute
- Subscribe to RSS Feed
- Permalink
- Report Inappropriate Content
What is the expected output here?
- Mark as New
- Bookmark
- Subscribe
- Mute
- Subscribe to RSS Feed
- Permalink
- Report Inappropriate Content
same as we you have helped me with. I want to use column D and Column E for the pivot table. it doesnt work for me as I have many other columns..
Note: I am planning on having condition to show the results only if the user select a single value from column C and one value on column A.
- « Previous Replies
-
- 1
- 2
- Next Replies »