Unlock a world of possibilities! Login now and discover the exclusive benefits awaiting you.
- Qlik Community
- :
- Forums
- :
- Analytics
- :
- App Development
- :
- Re: Pivot Table combining alternate states
- Subscribe to RSS Feed
- Mark Topic as New
- Mark Topic as Read
- Float this Topic for Current User
- Bookmark
- Subscribe
- Mute
- Printer Friendly Page
- Mark as New
- Bookmark
- Subscribe
- Mute
- Subscribe to RSS Feed
- Permalink
- Report Inappropriate Content
Pivot Table combining alternate states
Hello
I have a QS app that combines selections (stocks) from up to 5 separate alternate states, with state 1 containing a central set of dimensions (dates, frequency, metric name) and the other states containing only the respective selected tickers.
I am using substringcount (on variables containing each states' selections) and getselectedcount to pull the individual stocks in each of the states into one pivot table, this works well when the stock has records in the source table falling on all of the same dates in state 1, however, it fails when the stock has an incomplete recordset (IPO happened after the minimum state 1 date). It also works fine (even for states with stocks having incomplete recordsets) when aggregating the states' data to come up with a combined table and line chart of group medians (of the selected State 1 metric) where I am using a set expression to pass the State 1 dates using :: in the modifier.
Does my substringcount or getselectedcount expression in the pivot table need to use a similar modifier to correctly pull in the records of the stocks with incomplete records on the dates where data is available ? How would this be accomplished ideally?
Thanks
WH
- Subscribe by Topic:
-
Alternate States
-
Chart
-
GetSelectedCount
-
incomplete tables
-
Stocks
-
substringcount
- Mark as New
- Bookmark
- Subscribe
- Mute
- Subscribe to RSS Feed
- Permalink
- Report Inappropriate Content
Hi WH,
I realize that this is a month old, so I have a couple of questions assuming you are still trying to solve this problem:
1) To answer your question; Yes, you will likely need to incorporate the set analysis into your expressions to get the correct response. Have you tried this yet?
2) If you have not I have a couple of suggestions.
a) Use a straight table to systematically work out the various parts of the formula you will ultimately need to get the correct results for your counts. Then you can start combining parts into a single expression.
b) Because of the complex nature of what you are trying to do and knowing that multiple alternates states are concurrently in play, a sample app with data will be very helpful in trying to help you develop the expression(s).
c) Along with the sample app and data, an example of the table WITH the correct answers will be important to ensure that any expression that is develop - whether by you or someone else - is done correctly.
d) if there is any type of reference that explains the calculation you are trying to perform that will also help.
Regards,
Jeff Koch
- Mark as New
- Bookmark
- Subscribe
- Mute
- Subscribe to RSS Feed
- Permalink
- Report Inappropriate Content
Hi Jeff
Thank you for your reply and offer to help.
I'm unsure how to employ set analysis in this situation since I am not aggregating but simply trying to pull in each alternate states' selections' datapoints to display in the same pivot table.
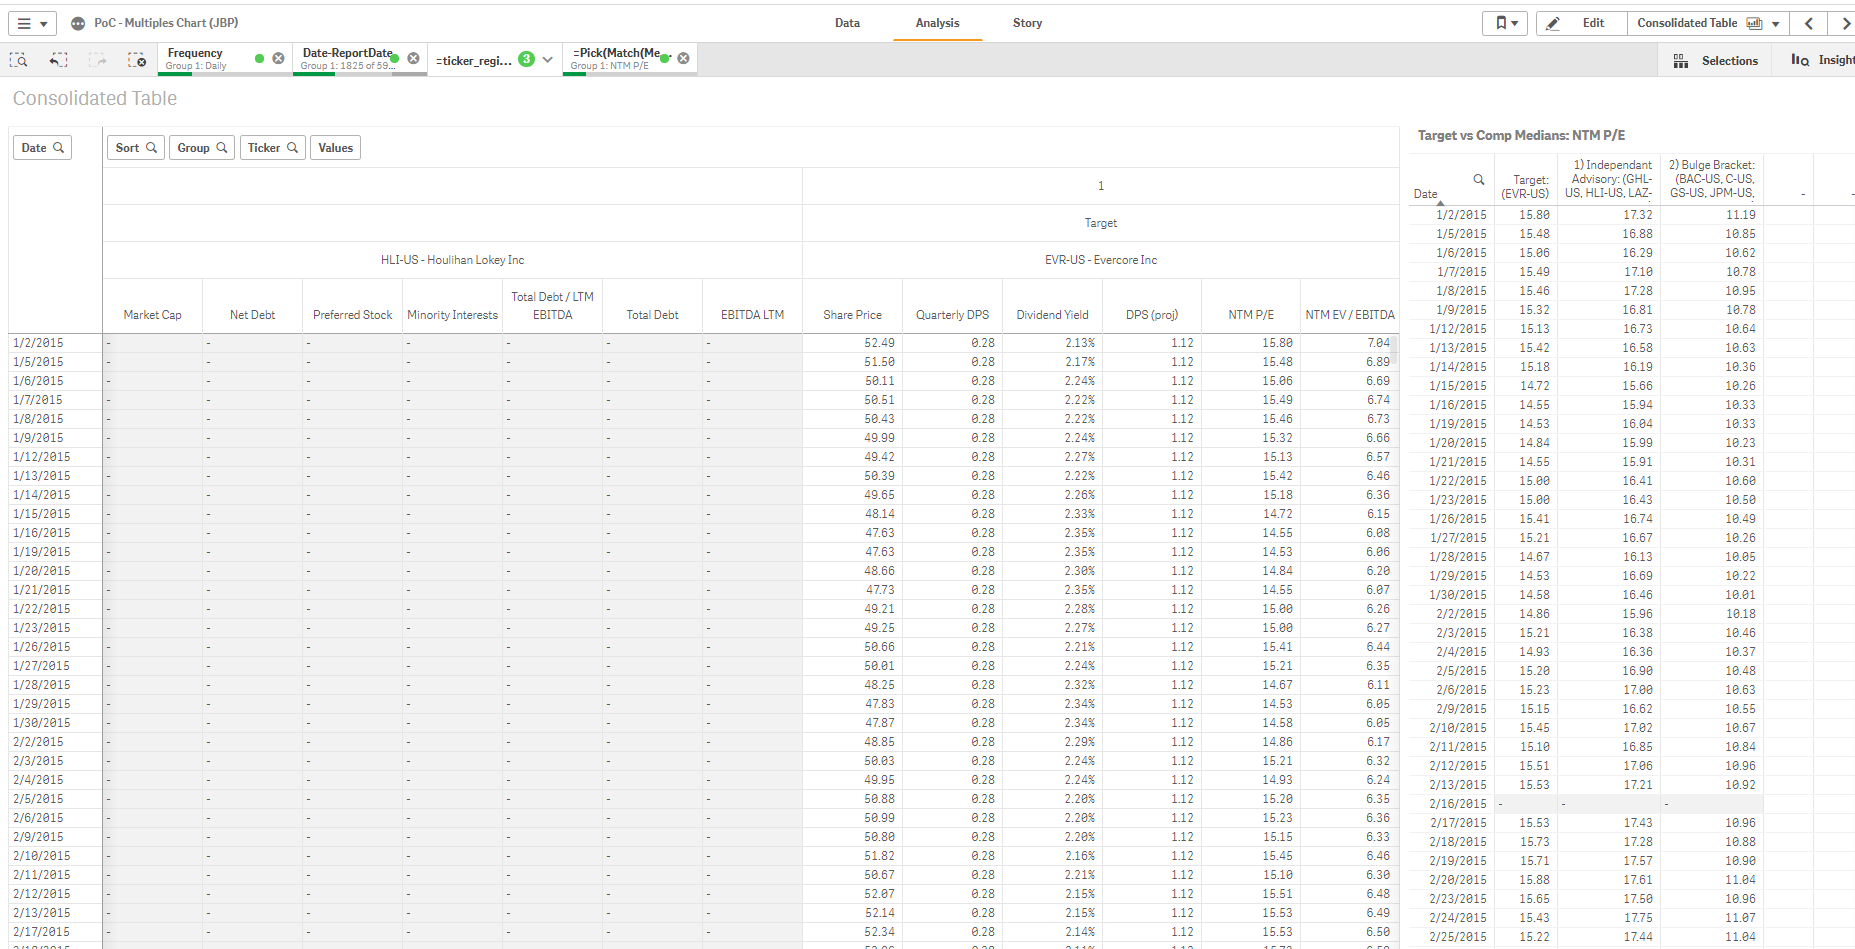
(See attachment #1) The table on the right appears to be working correctly to aggregate the groups' medians for 'Independant Advisory' across the same date range, but it is not working in the table on the left to pull the group name or reference the selection as a part of the 'Sort' dummy dimension for HLI-US, whose records start on 8/12/15.
The formulas work to pull in the data for all selections which have records on all the days in the selected date range, but not for selections which do not have records in the selected date range.
How do I create a sample app to send to you ?
Thanks
Will
- Mark as New
- Bookmark
- Subscribe
- Mute
- Subscribe to RSS Feed
- Permalink
- Report Inappropriate Content
Typically an app is simply attached as part of a reply. But if you so, I strongly suggest that you build a set of dummy data (excel usually works well for this) and build the app using dummy data. You do not want to post anything that is propitiatory or contains any type of PII or PHI information.
You only need enough information to support the calculation, so if you have a data model of 500 fields, and only 10 fields are needed just build an app with a data model of the 10 fields. For visualization, you only need the table(s) and any supporting visualization objects.
You only need enough data to support the calculation.
If possible, include the excel or csv file(s) as part of the upload. On occasion part of the solution includes a modification to the data model; for example, adding a derived field to simplify the expression, improve performance or both.
-Jeff