Unlock a world of possibilities! Login now and discover the exclusive benefits awaiting you.
- Qlik Community
- :
- Forums
- :
- Analytics
- :
- App Development
- :
- Re: Pivot table numbers change when I drill down o...
- Subscribe to RSS Feed
- Mark Topic as New
- Mark Topic as Read
- Float this Topic for Current User
- Bookmark
- Subscribe
- Mute
- Printer Friendly Page
- Mark as New
- Bookmark
- Subscribe
- Mute
- Subscribe to RSS Feed
- Permalink
- Report Inappropriate Content
Pivot table numbers change when I drill down on rows
I have a pivot table which I would like users to drill down on rows as follows:
Location
Grower
Ranch
Commodity
Work Order
The number they will be viewing is a formula, based on other formulas. The resulting number for this formula seems to change as I drill down. Here is the formula for Total Profit/Loss:
Net Proceeds- ValueHarvested.
Net Proceeds is defined as Sum(GrossProceeds) - Sum(GrossCost)
ValueHarvested is defined as (Sum(Acres) * Avg(CostPerAcre))
The final expression looks like this:
sum(GrossProceeds) - sum(GrossCost)) - (Sum(Acres) * Avg(CostPerAcre)
I've done some digging around in the forums and I can't quite figure out what might be causing the numbers to change as I drill down. Could it be that I need to use Aggr? Perhaps I need to use Dimensionality? Any help would be appreciated. Thanks.
Here's what the numbers look like before I drill down to level 3:
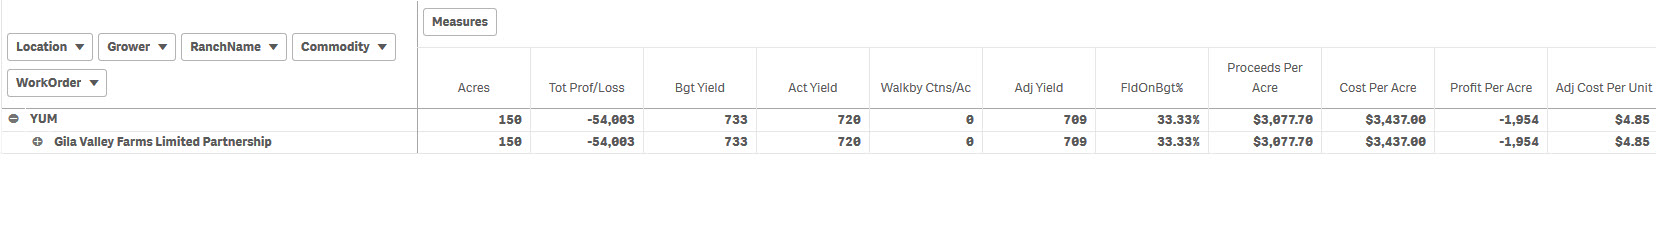
When I drill down to level 3, it changes to this:
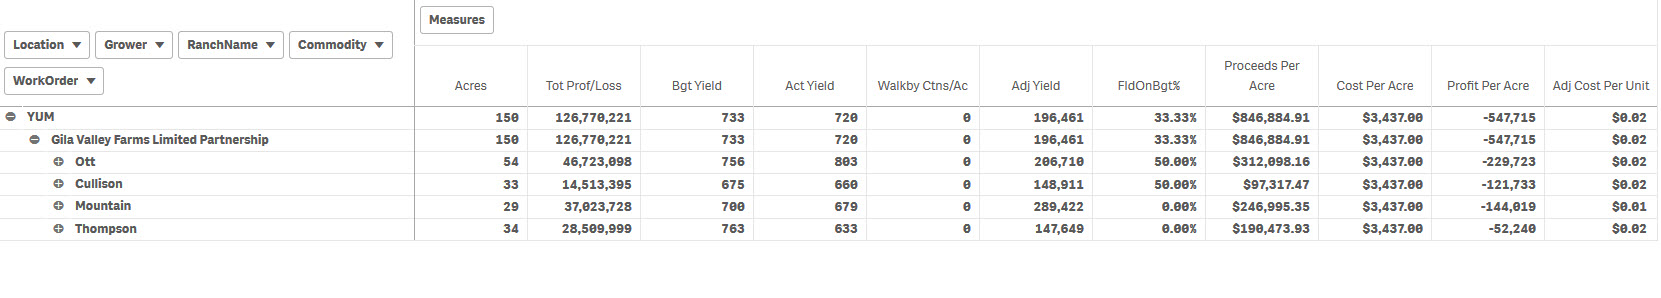
Other numbers change too, not just the Total Profit/Loss number that I mentioned above.
I created a separate "test" pivot table, that includes fewer measures. In the test pivot table, everything works fine:
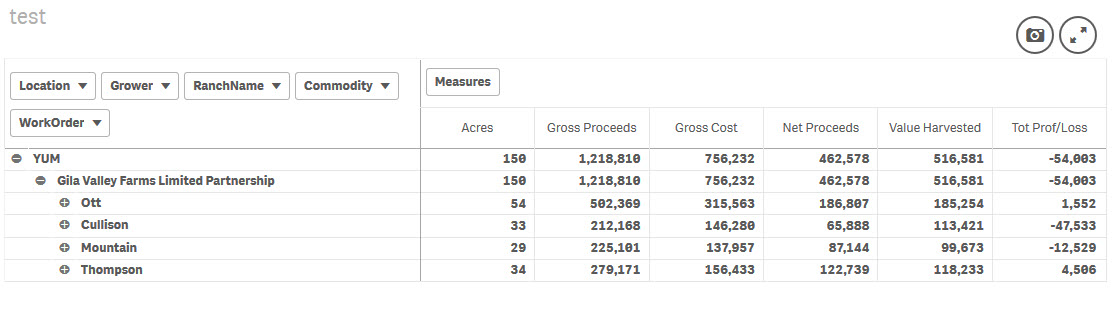
I think it has something to do with the other measures in the "broken" pivot table; either there are too many (11), or one or more of them is causing my expression to get "confused".
Any ideas or suggestions?
Thanks!
- Mark as New
- Bookmark
- Subscribe
- Mute
- Subscribe to RSS Feed
- Permalink
- Report Inappropriate Content
Understood; I caught that after I posted the last qvf. I reloaded the data and the Net Proceeds are now there, but the behavior is still the same. As soon as I drill down to Location -> Grower -> Ranch -> and expand a ranch, the number changes.
- Mark as New
- Bookmark
- Subscribe
- Mute
- Subscribe to RSS Feed
- Permalink
- Report Inappropriate Content
Update qvf attached.
- Mark as New
- Bookmark
- Subscribe
- Mute
- Subscribe to RSS Feed
- Permalink
- Report Inappropriate Content
Hi.
Check it out now. It should work. It works for me.
Regards.
- Mark as New
- Bookmark
- Subscribe
- Mute
- Subscribe to RSS Feed
- Permalink
- Report Inappropriate Content
What changed? It does seem to be working now.
- Mark as New
- Bookmark
- Subscribe
- Mute
- Subscribe to RSS Feed
- Permalink
- Report Inappropriate Content
Ooops, spoke too soon. I'm still having an issue when I add more columns to Measures. Several measures are behaving this way.
- Mark as New
- Bookmark
- Subscribe
- Mute
- Subscribe to RSS Feed
- Permalink
- Report Inappropriate Content
Hi.
It does not open the file, it is corrupt.
But you should try to do what we did to calculate: "Tot Prof / Loss" for the other measures.
Regards.
- Mark as New
- Bookmark
- Subscribe
- Mute
- Subscribe to RSS Feed
- Permalink
- Report Inappropriate Content
Here's another copy.
I don't believe the solution worked for the Tot Prof / Loss measure. As soon as I added other measures to the pivot table the behavior for that measure, as well as other measures, begins to happen again.
- Mark as New
- Bookmark
- Subscribe
- Mute
- Subscribe to RSS Feed
- Permalink
- Report Inappropriate Content
Attaching again. Last attachment didn't seem to work.
- Mark as New
- Bookmark
- Subscribe
- Mute
- Subscribe to RSS Feed
- Permalink
- Report Inappropriate Content
Hi.
Check the expression FldOnBgt%, you are using a key field: "WorkOrder", you should create another field with this, called "WorkOrderCount" to be able to use it in the expression: Sum (FldOnBgtFlag) / Count (DISTINCT WorkOrderCount)
Regards.
- Mark as New
- Bookmark
- Subscribe
- Mute
- Subscribe to RSS Feed
- Permalink
- Report Inappropriate Content
That did the trick! Perhaps Qlik was counting workorders from the foreign key table as well? Strange that the numbers were good for Location/Grower/Ranch but started to go crazy at the next level of drill-down.
Isolating the WorkOrders as a separate field in one table as WorkOrderCount, and then basing the formula off that measure was the key to solving the issue.
Thank you very much!